Adaptive Block Size Limit Comparisons
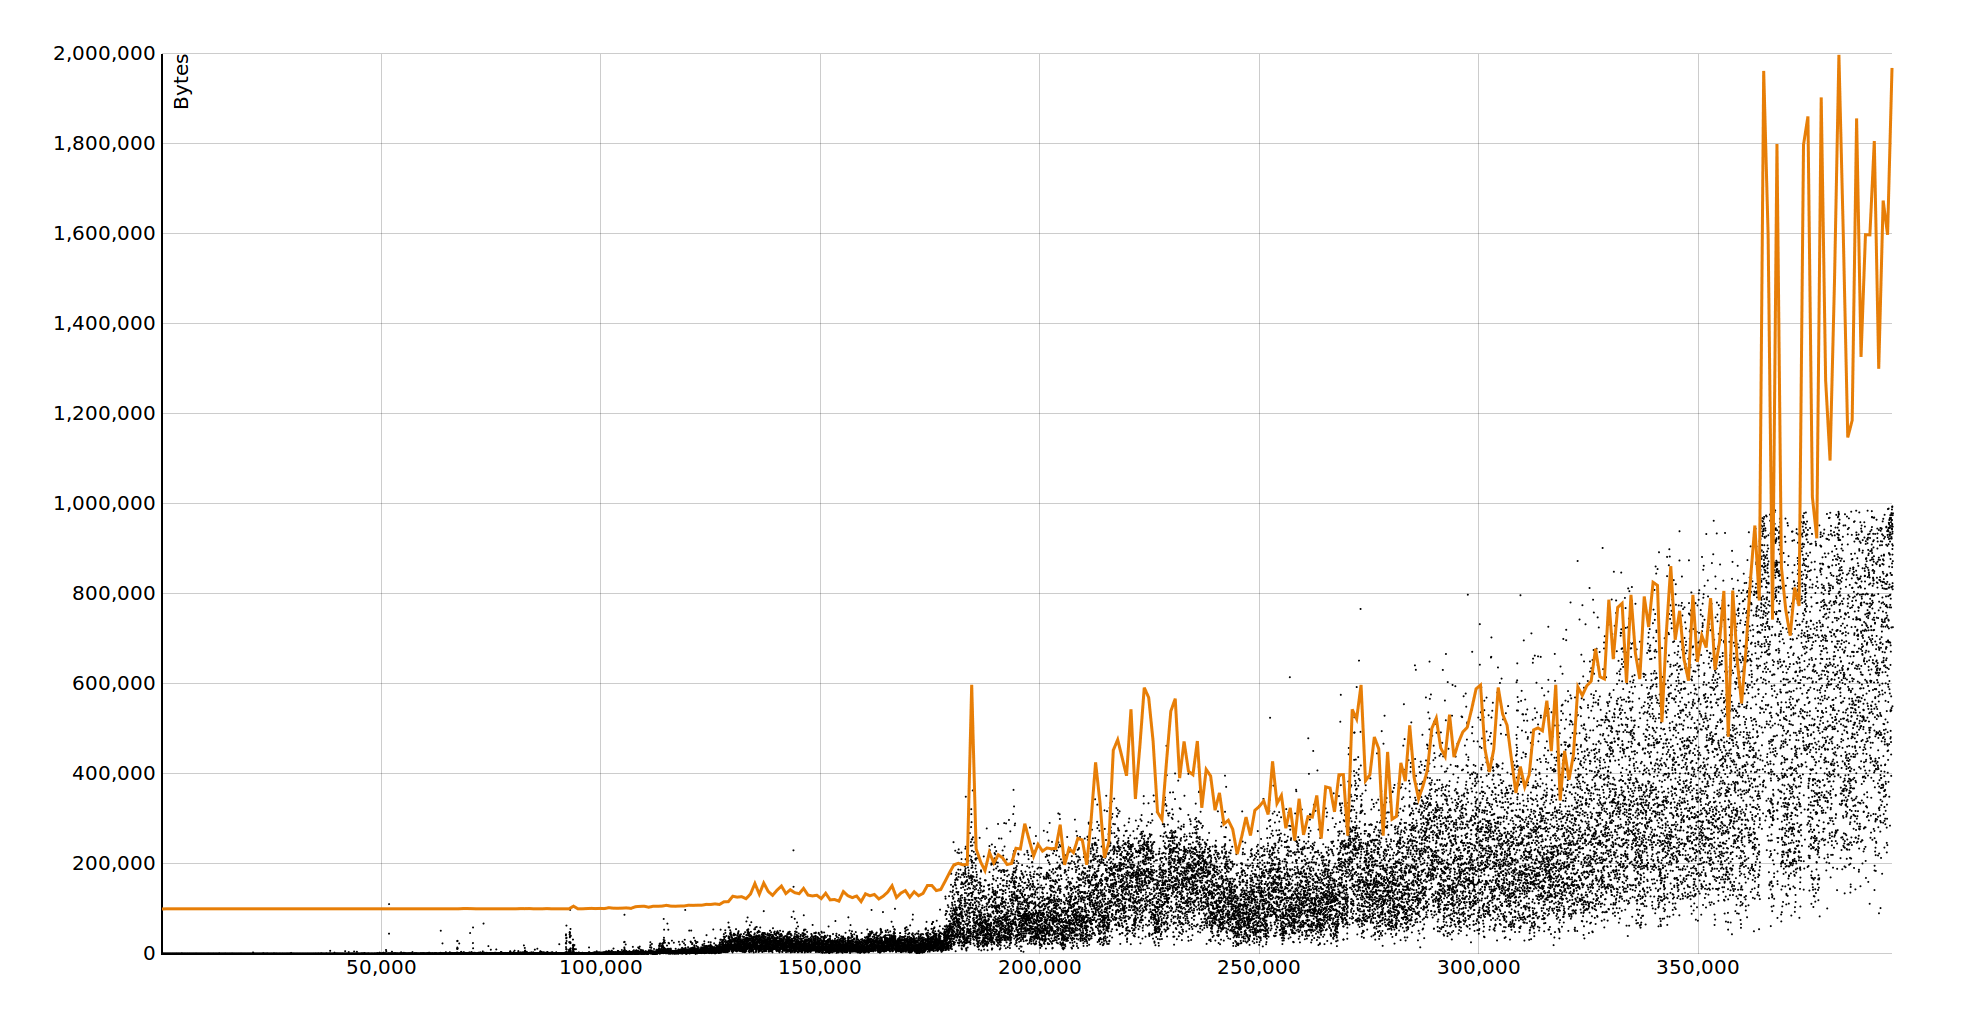
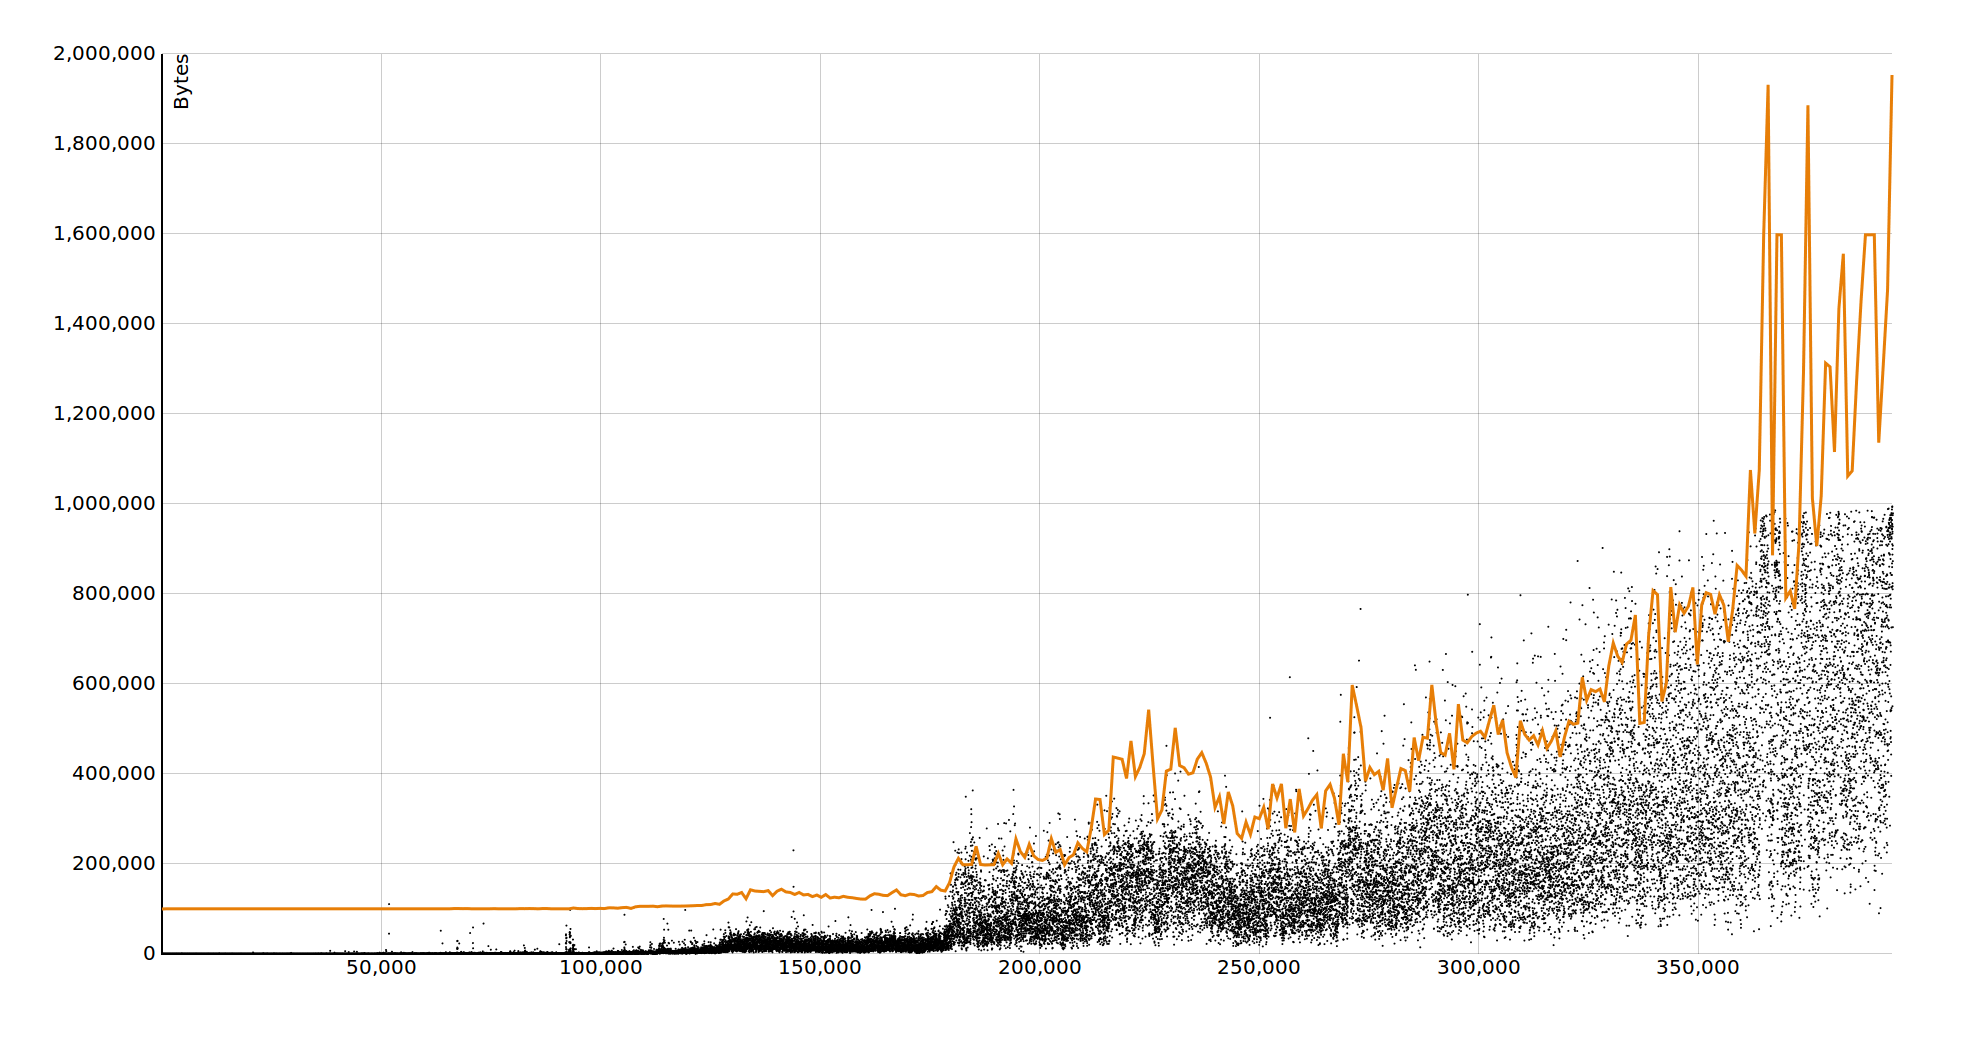
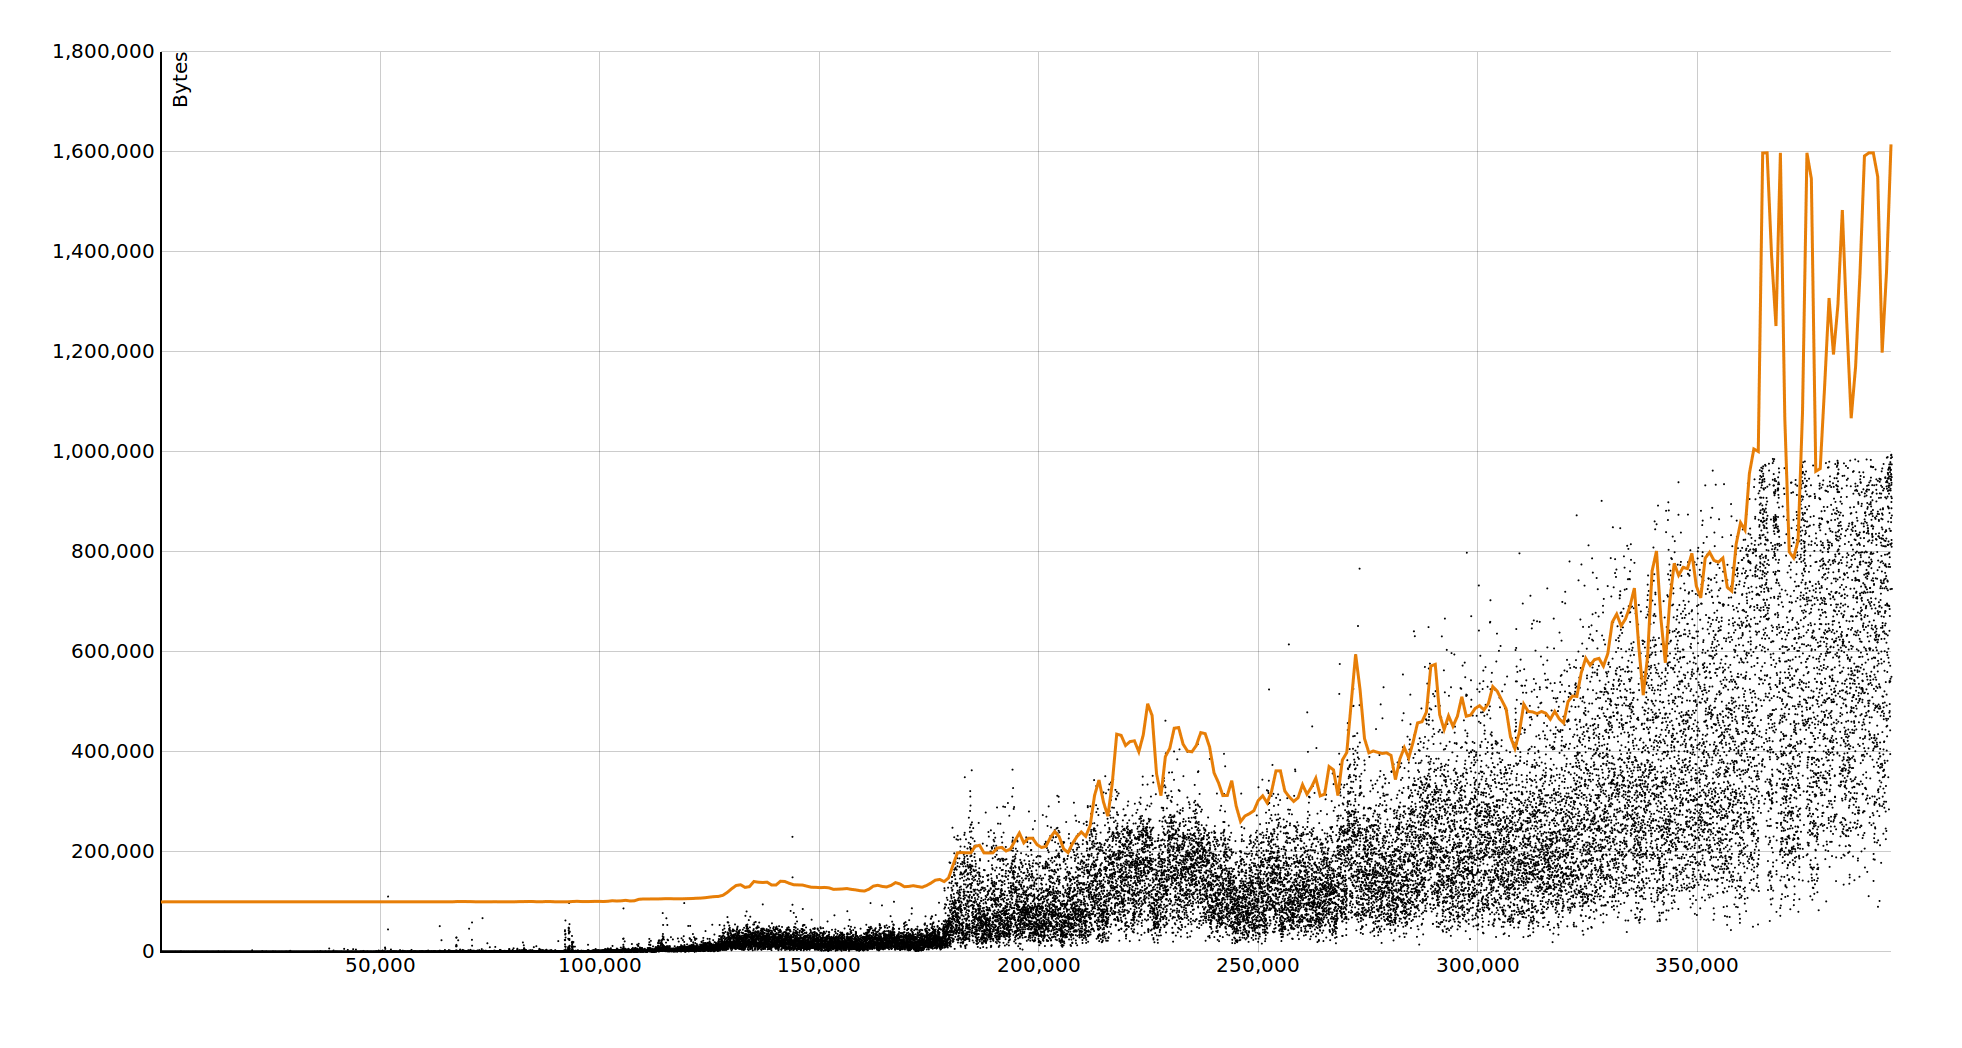
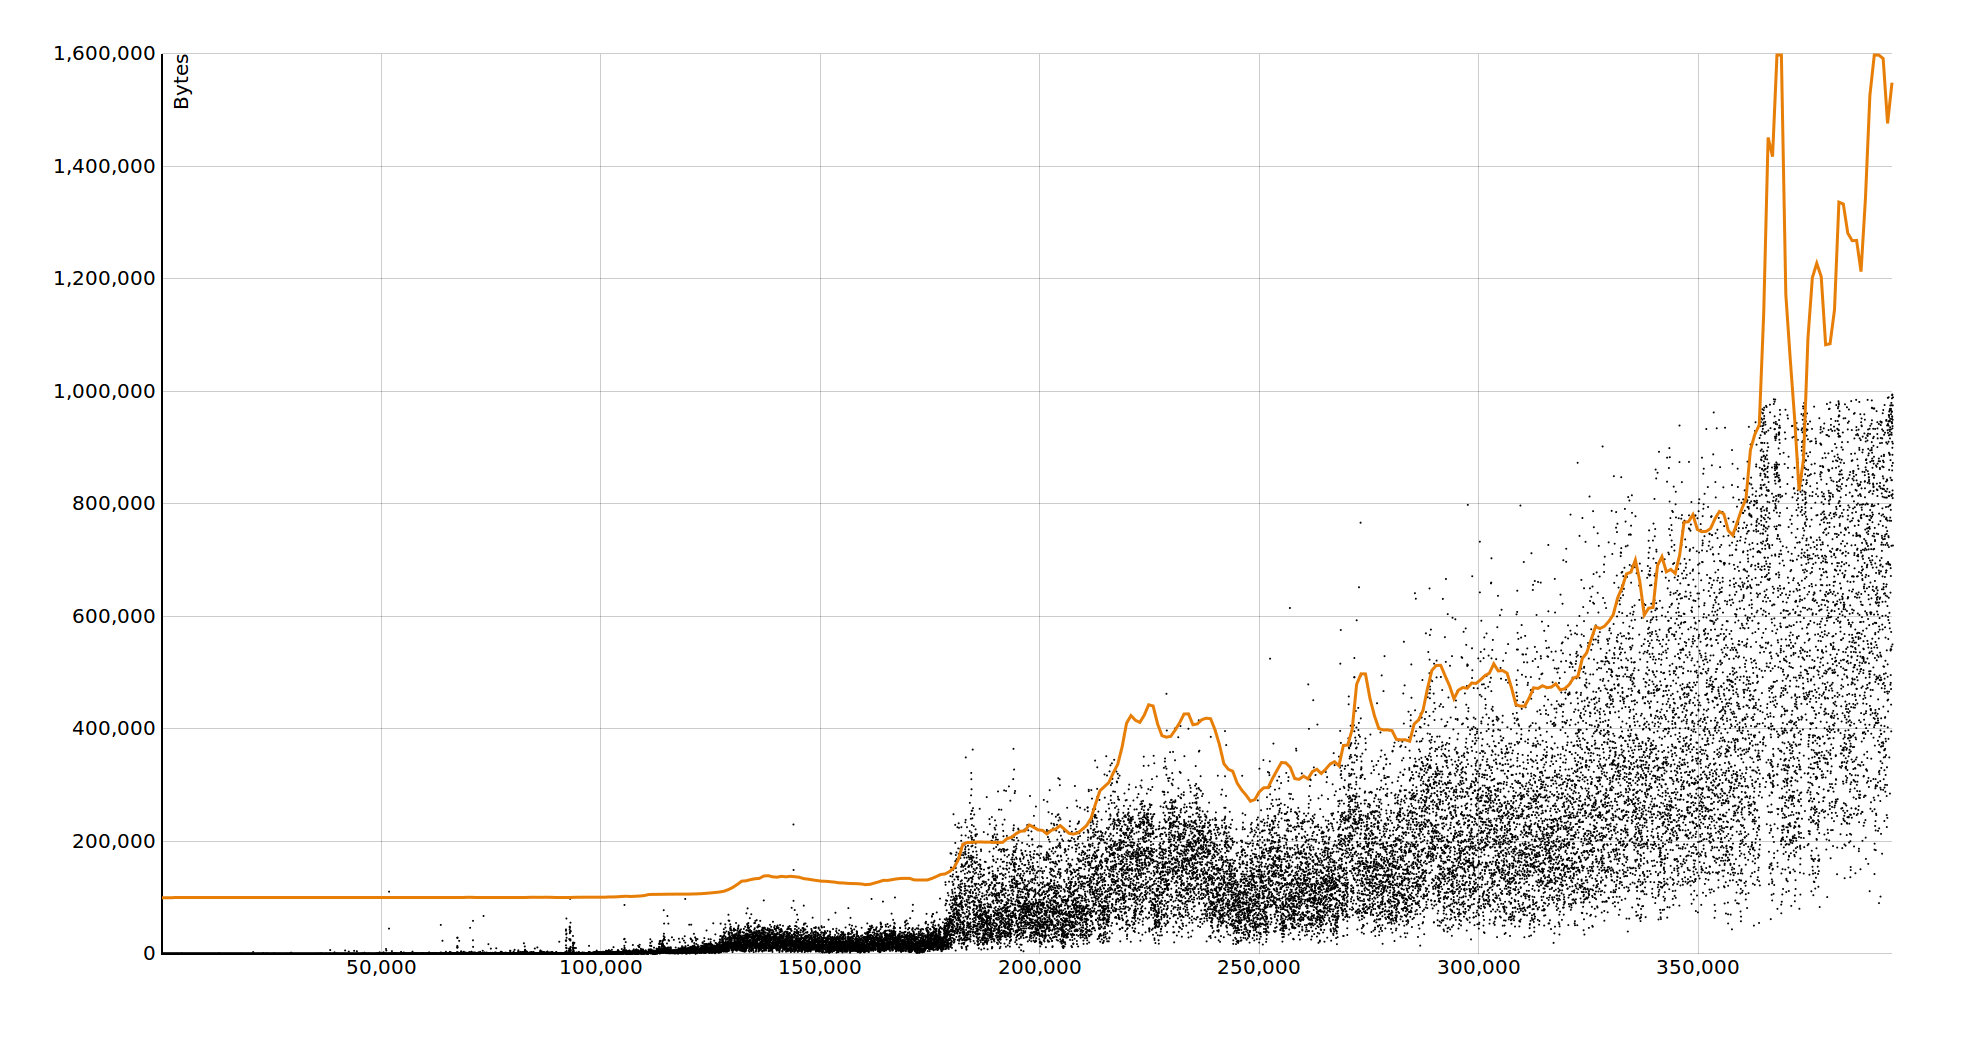
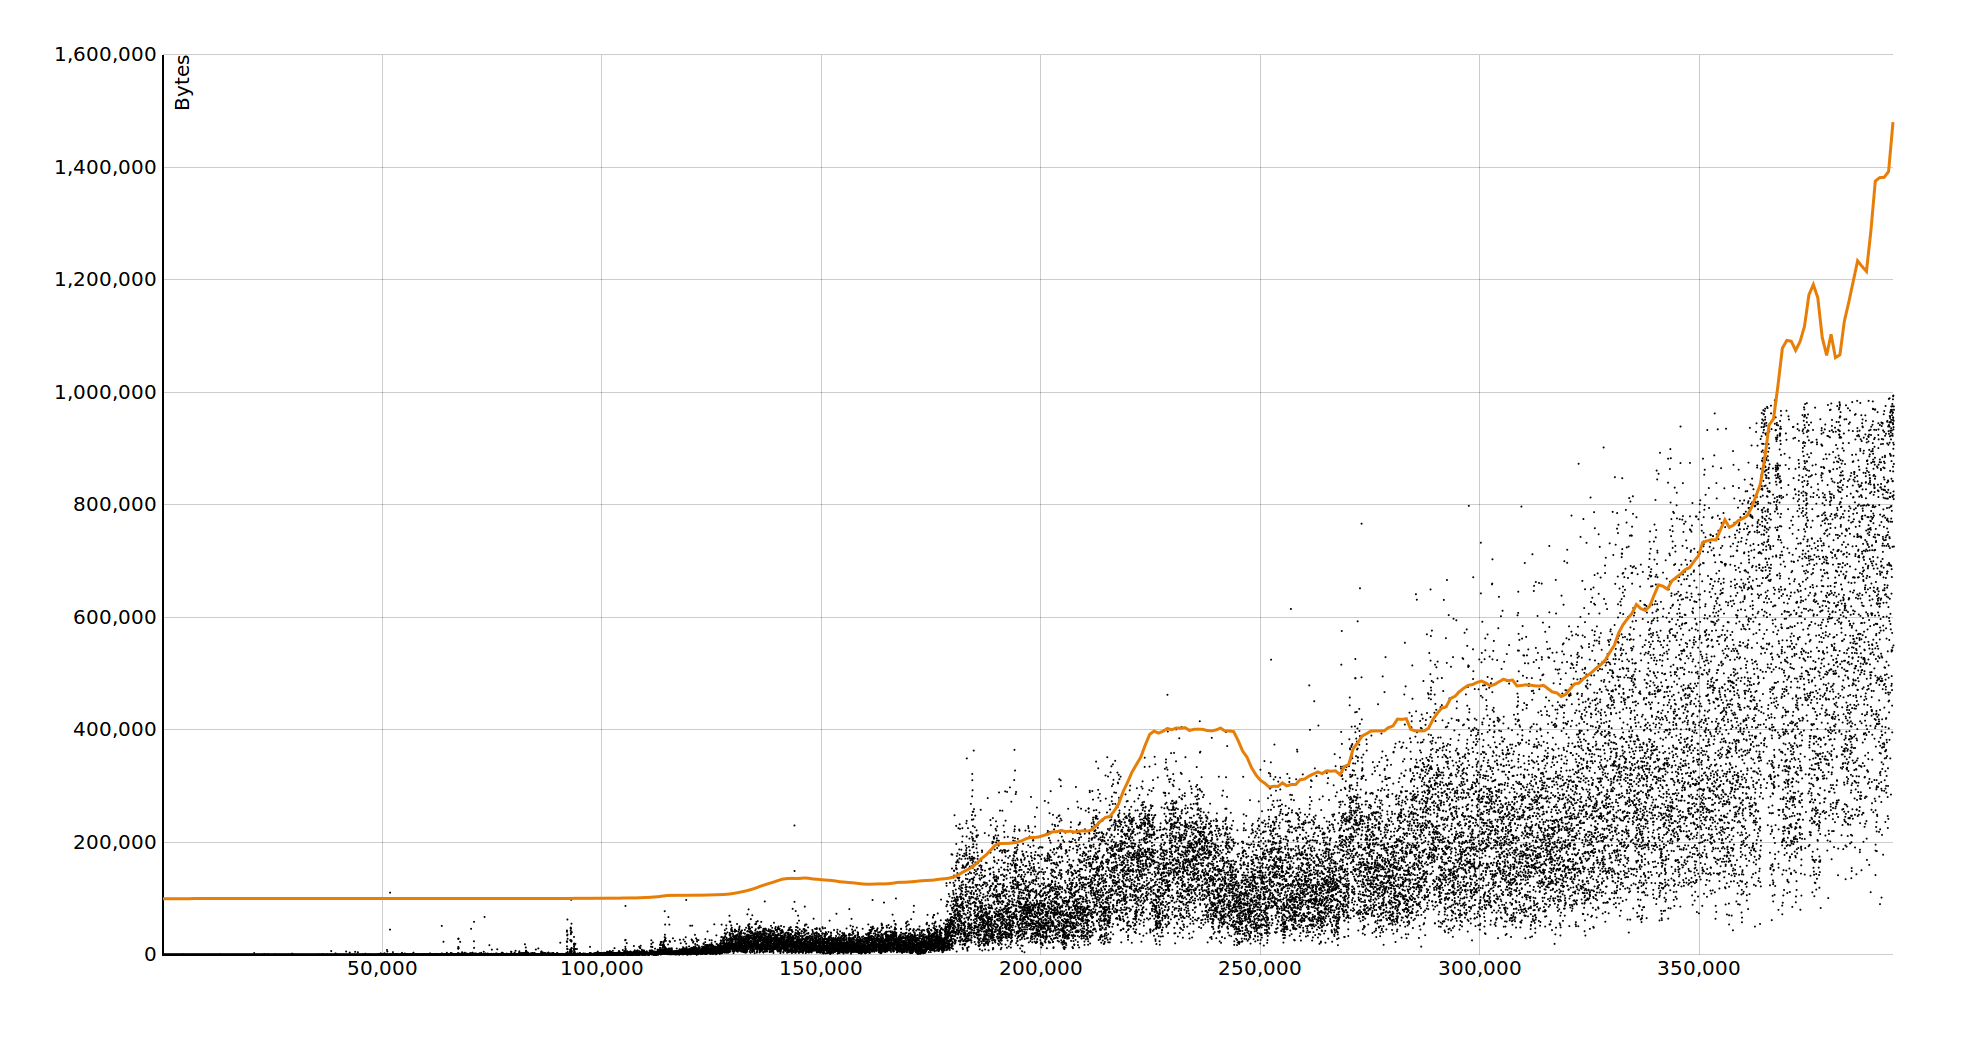
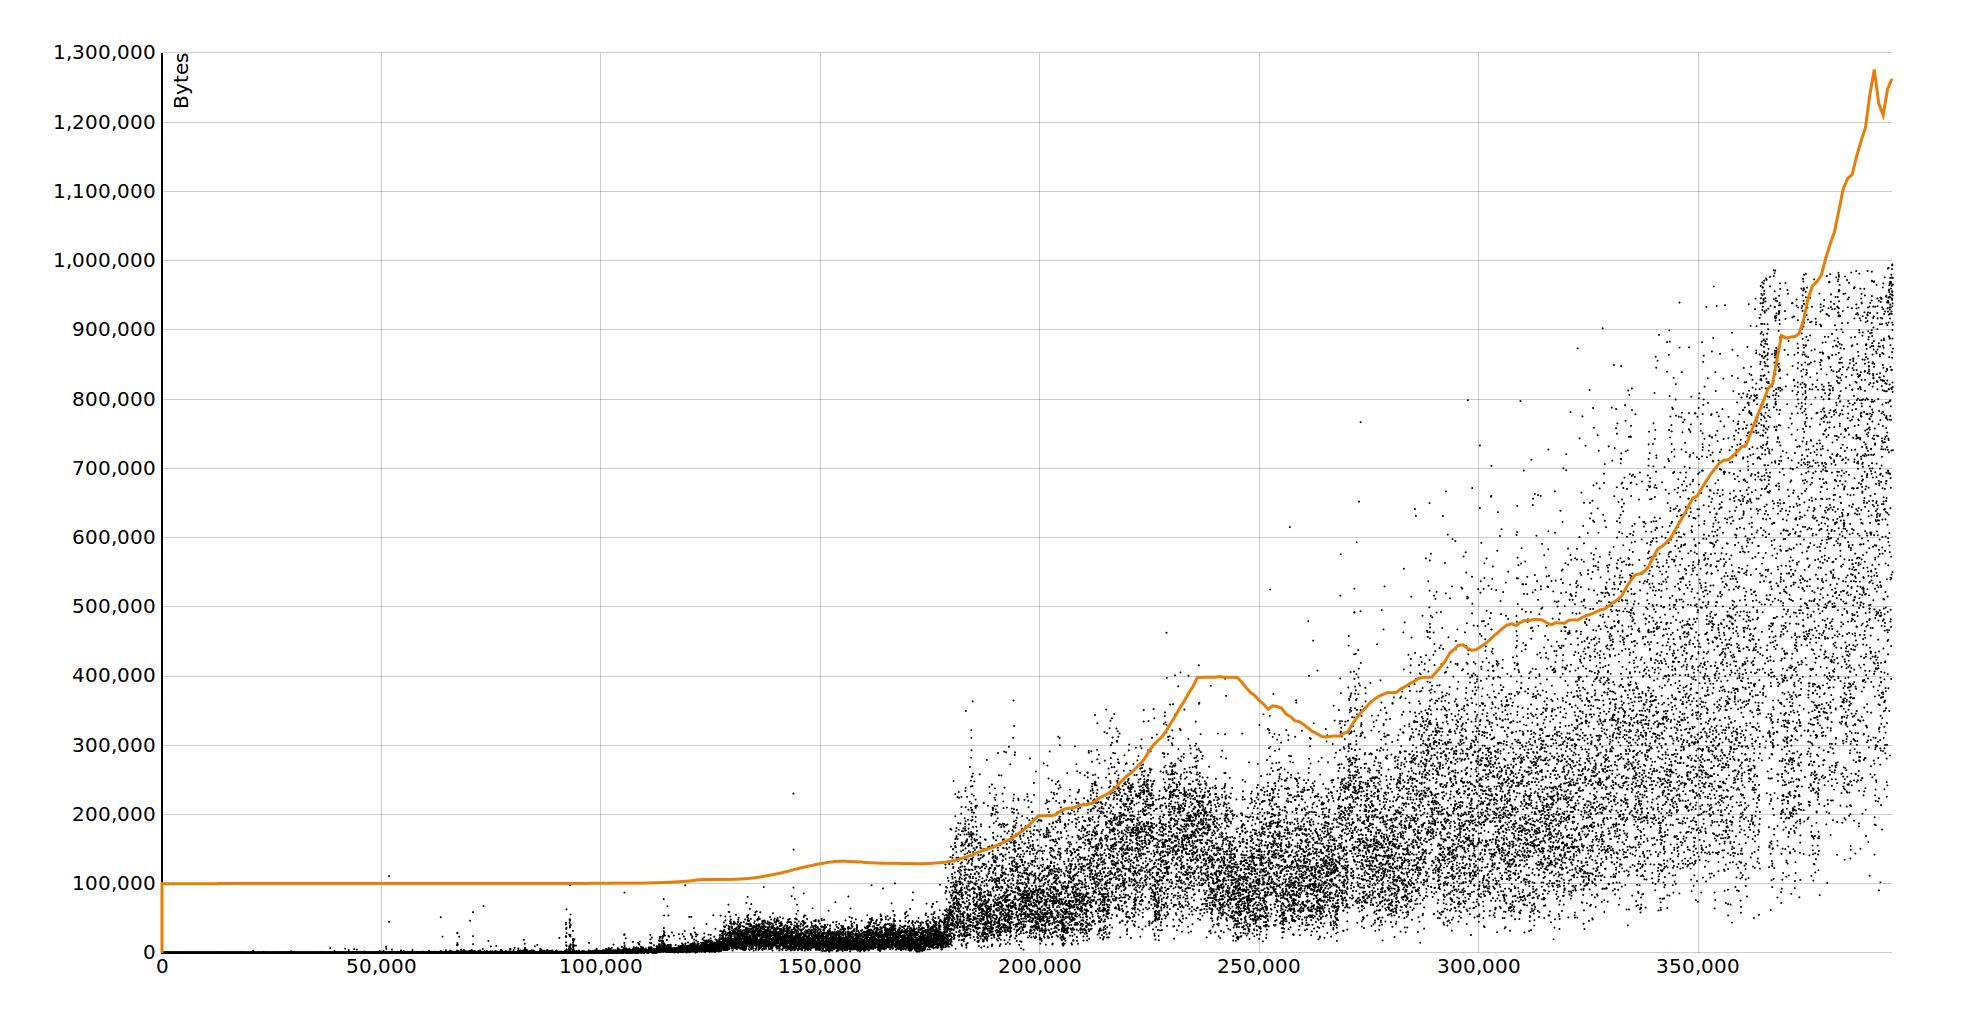
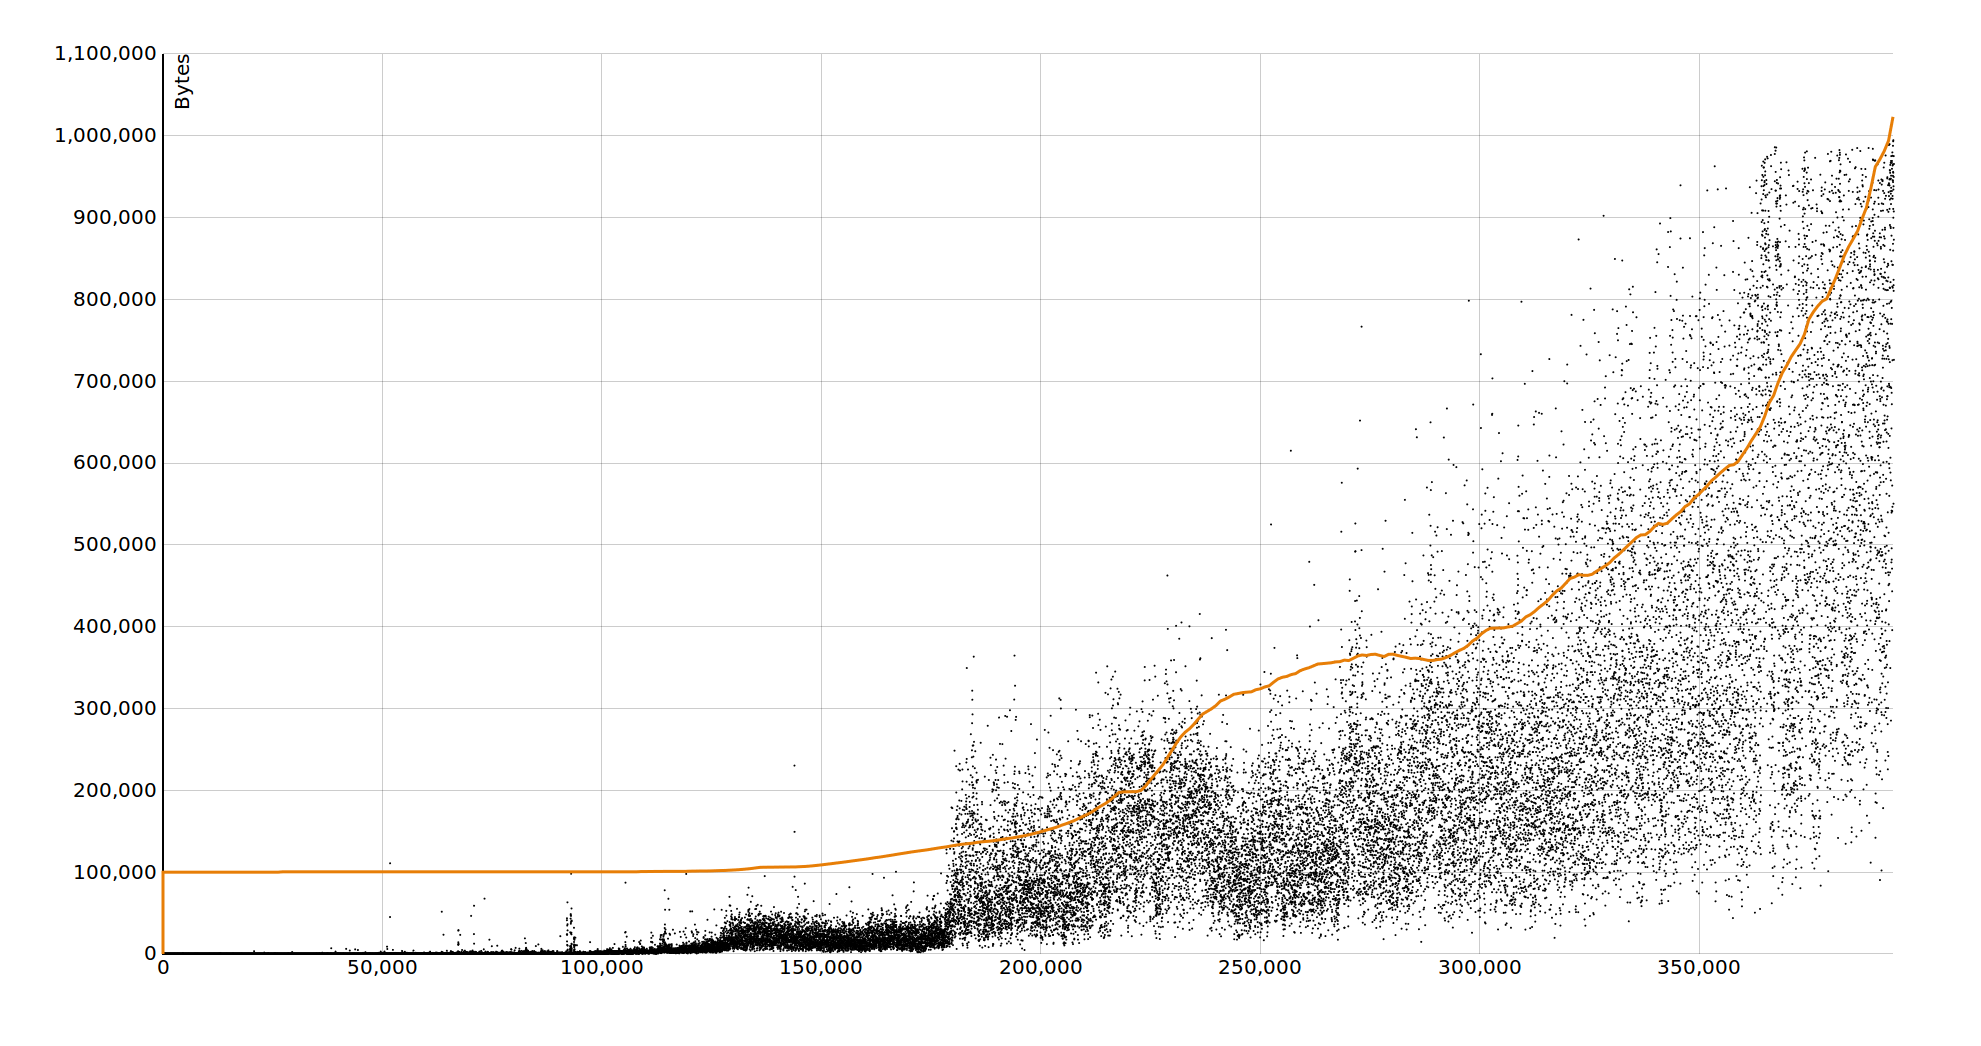
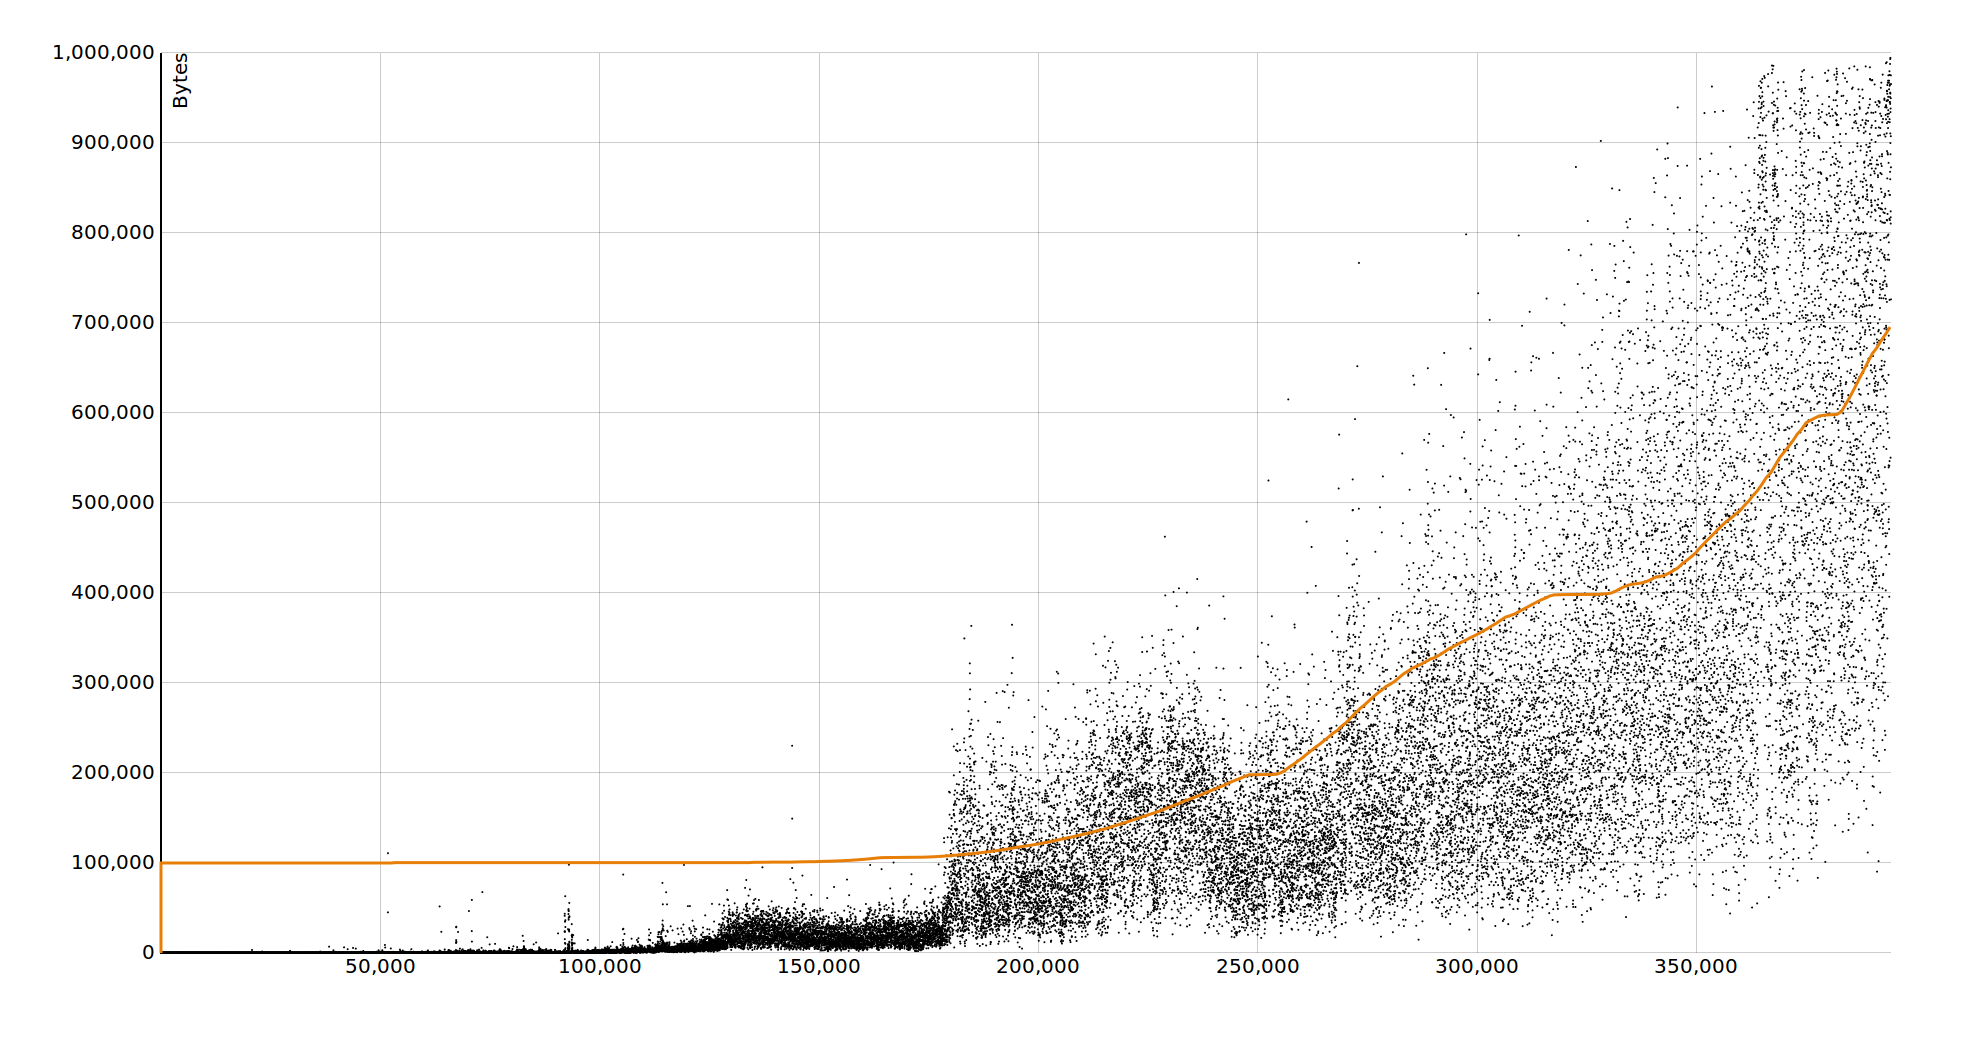
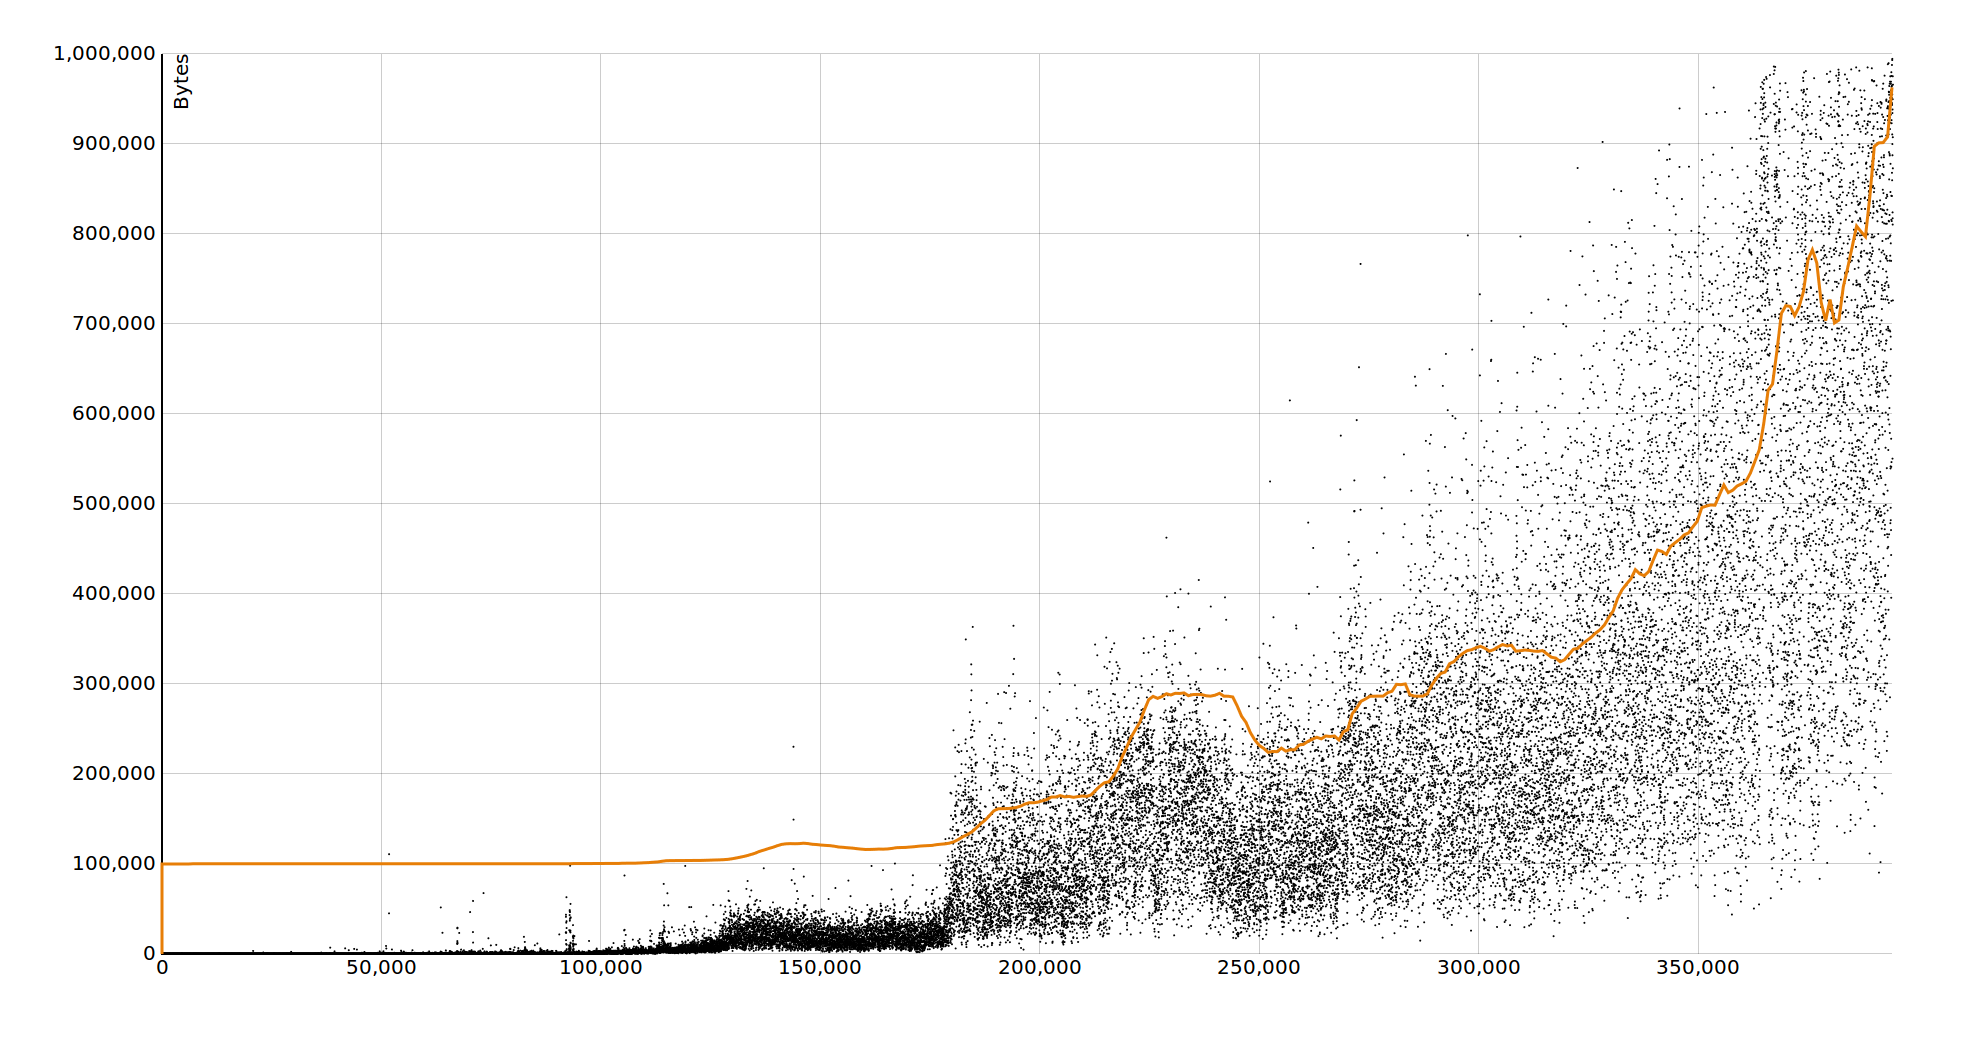
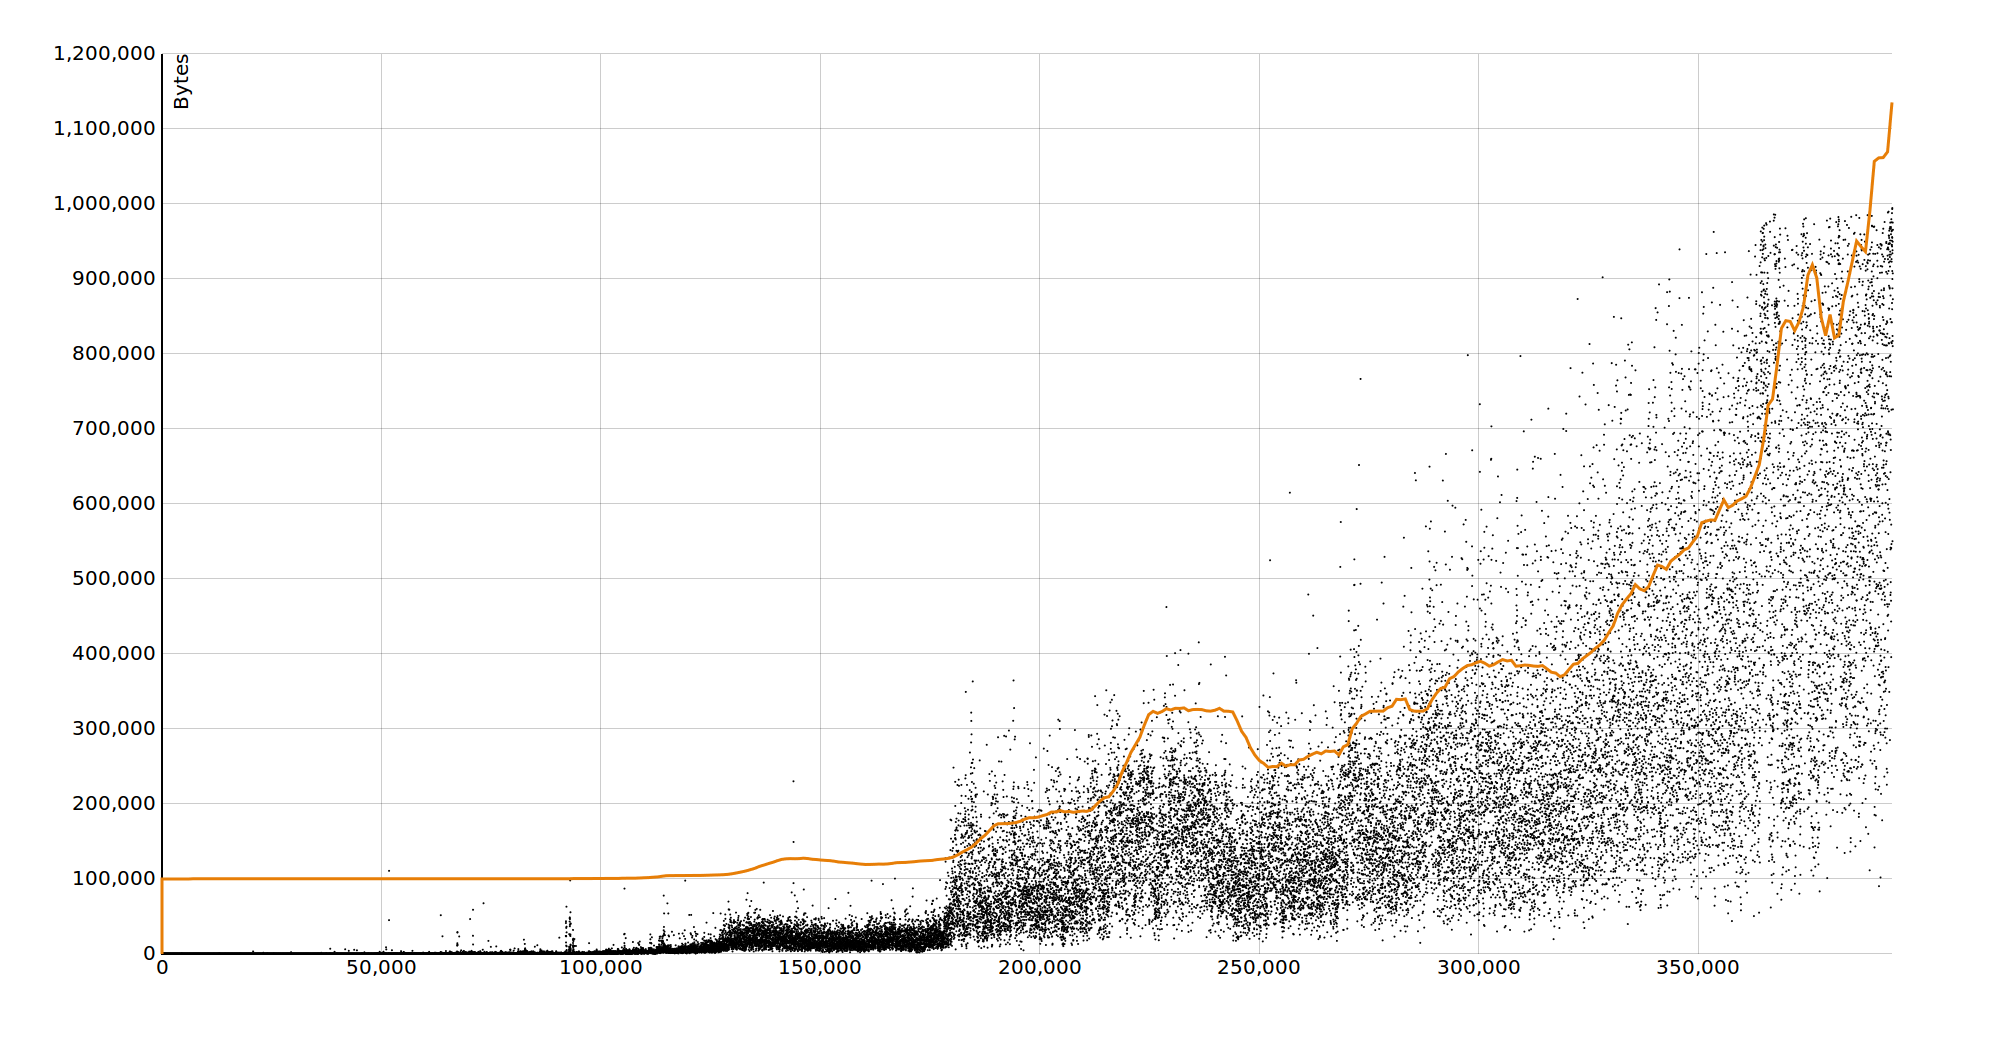
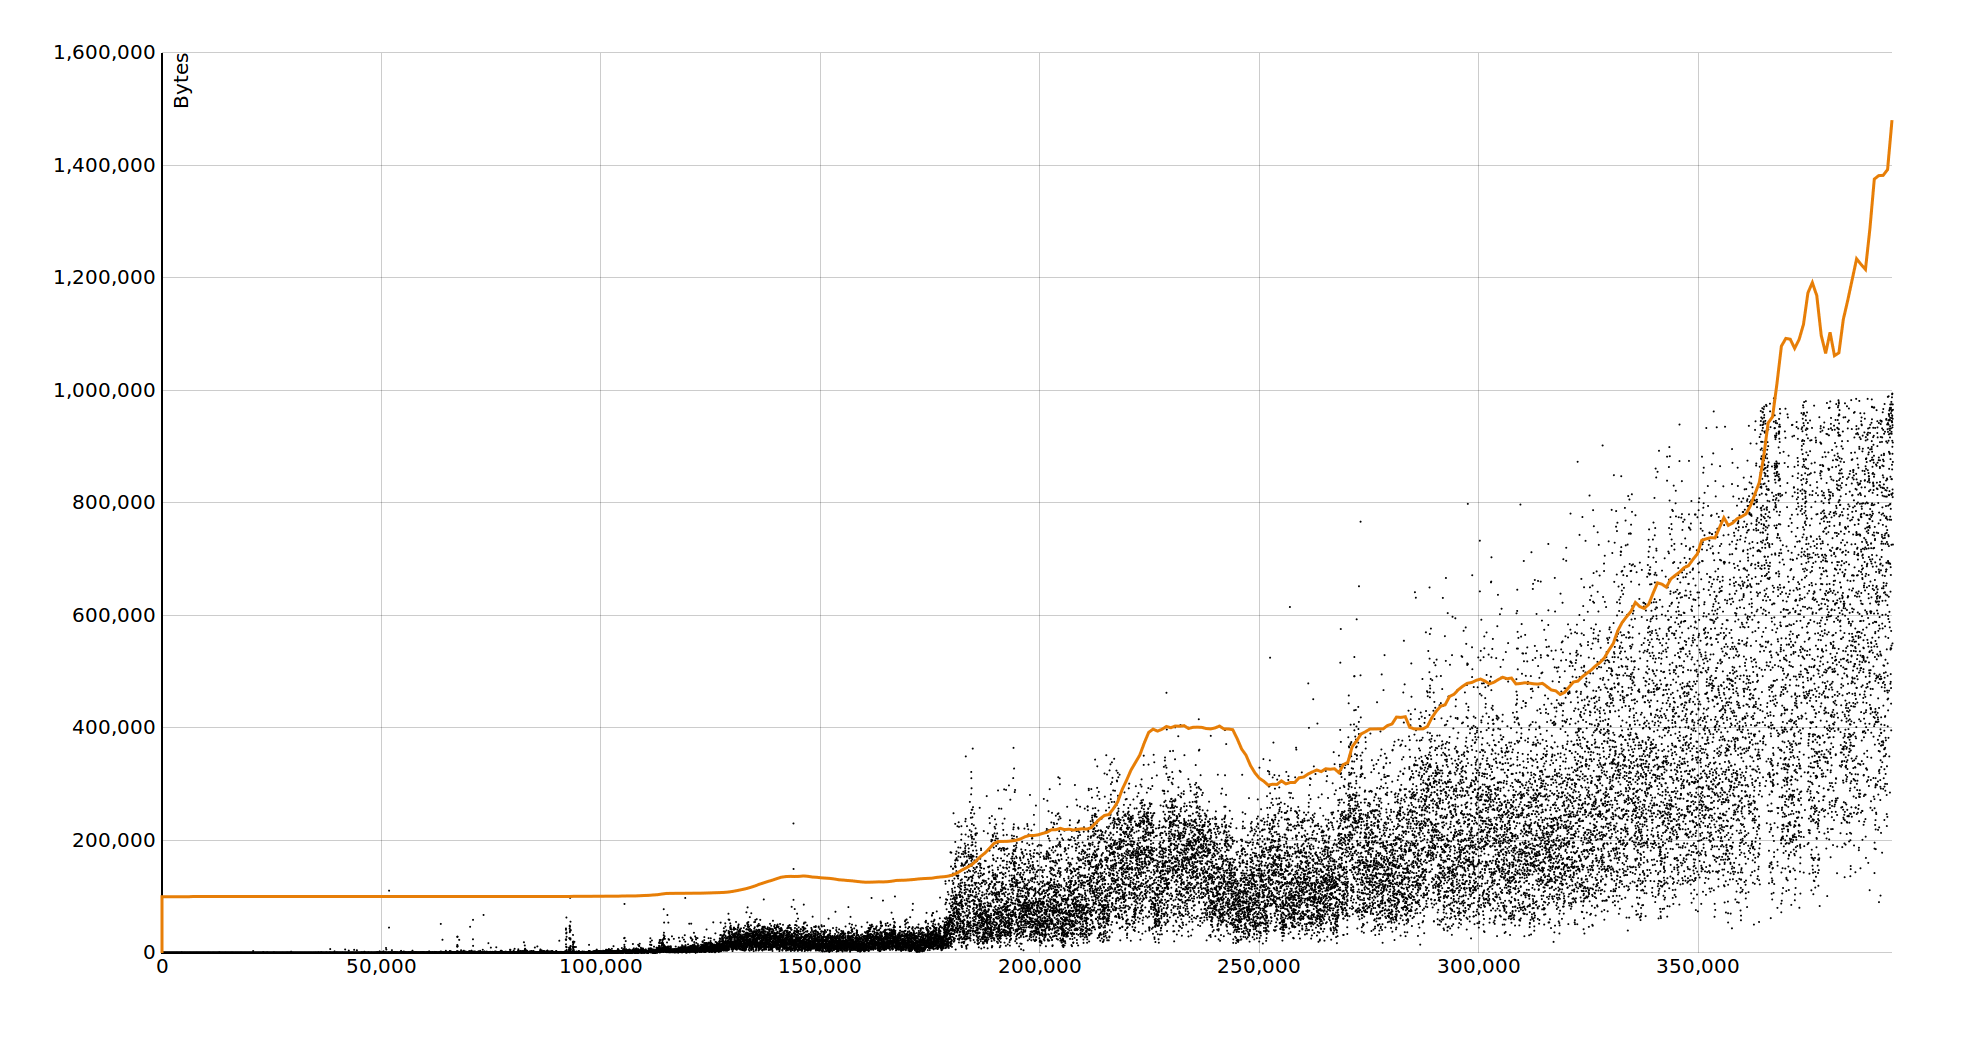
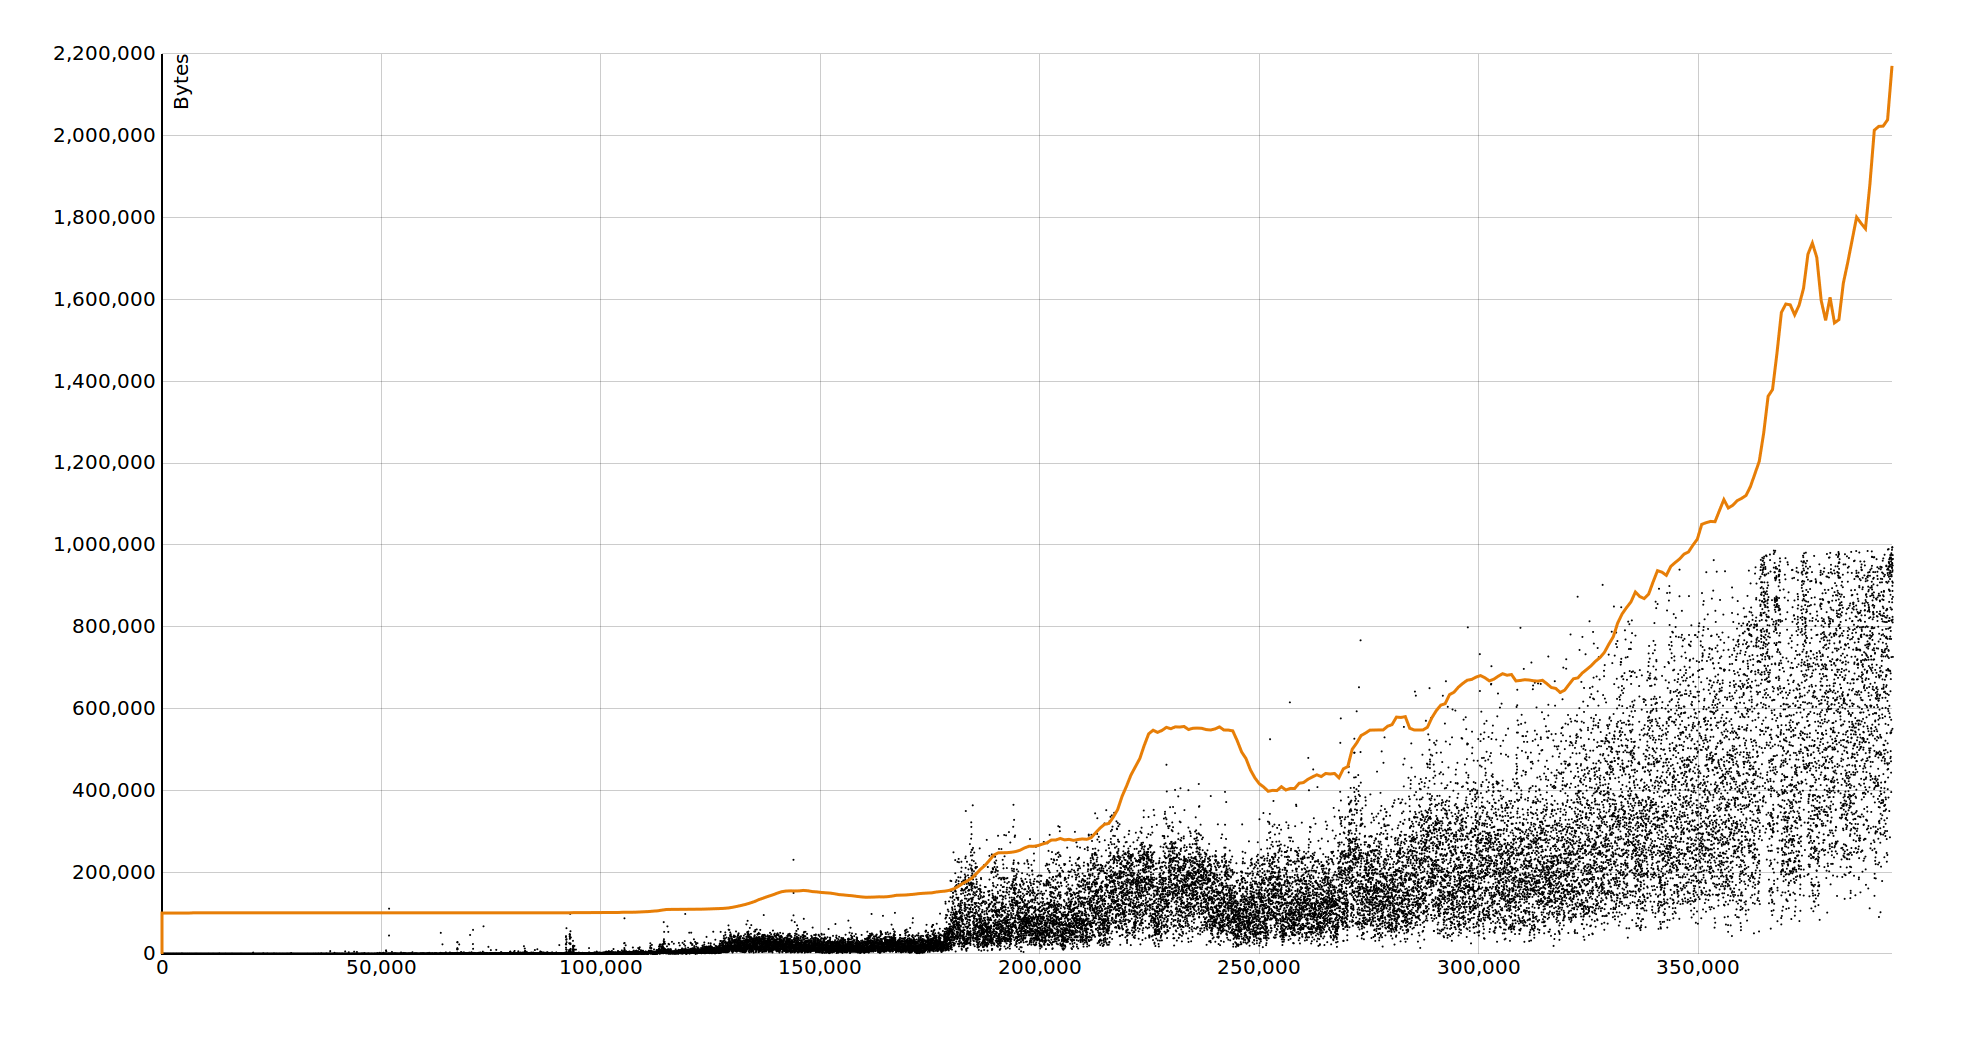
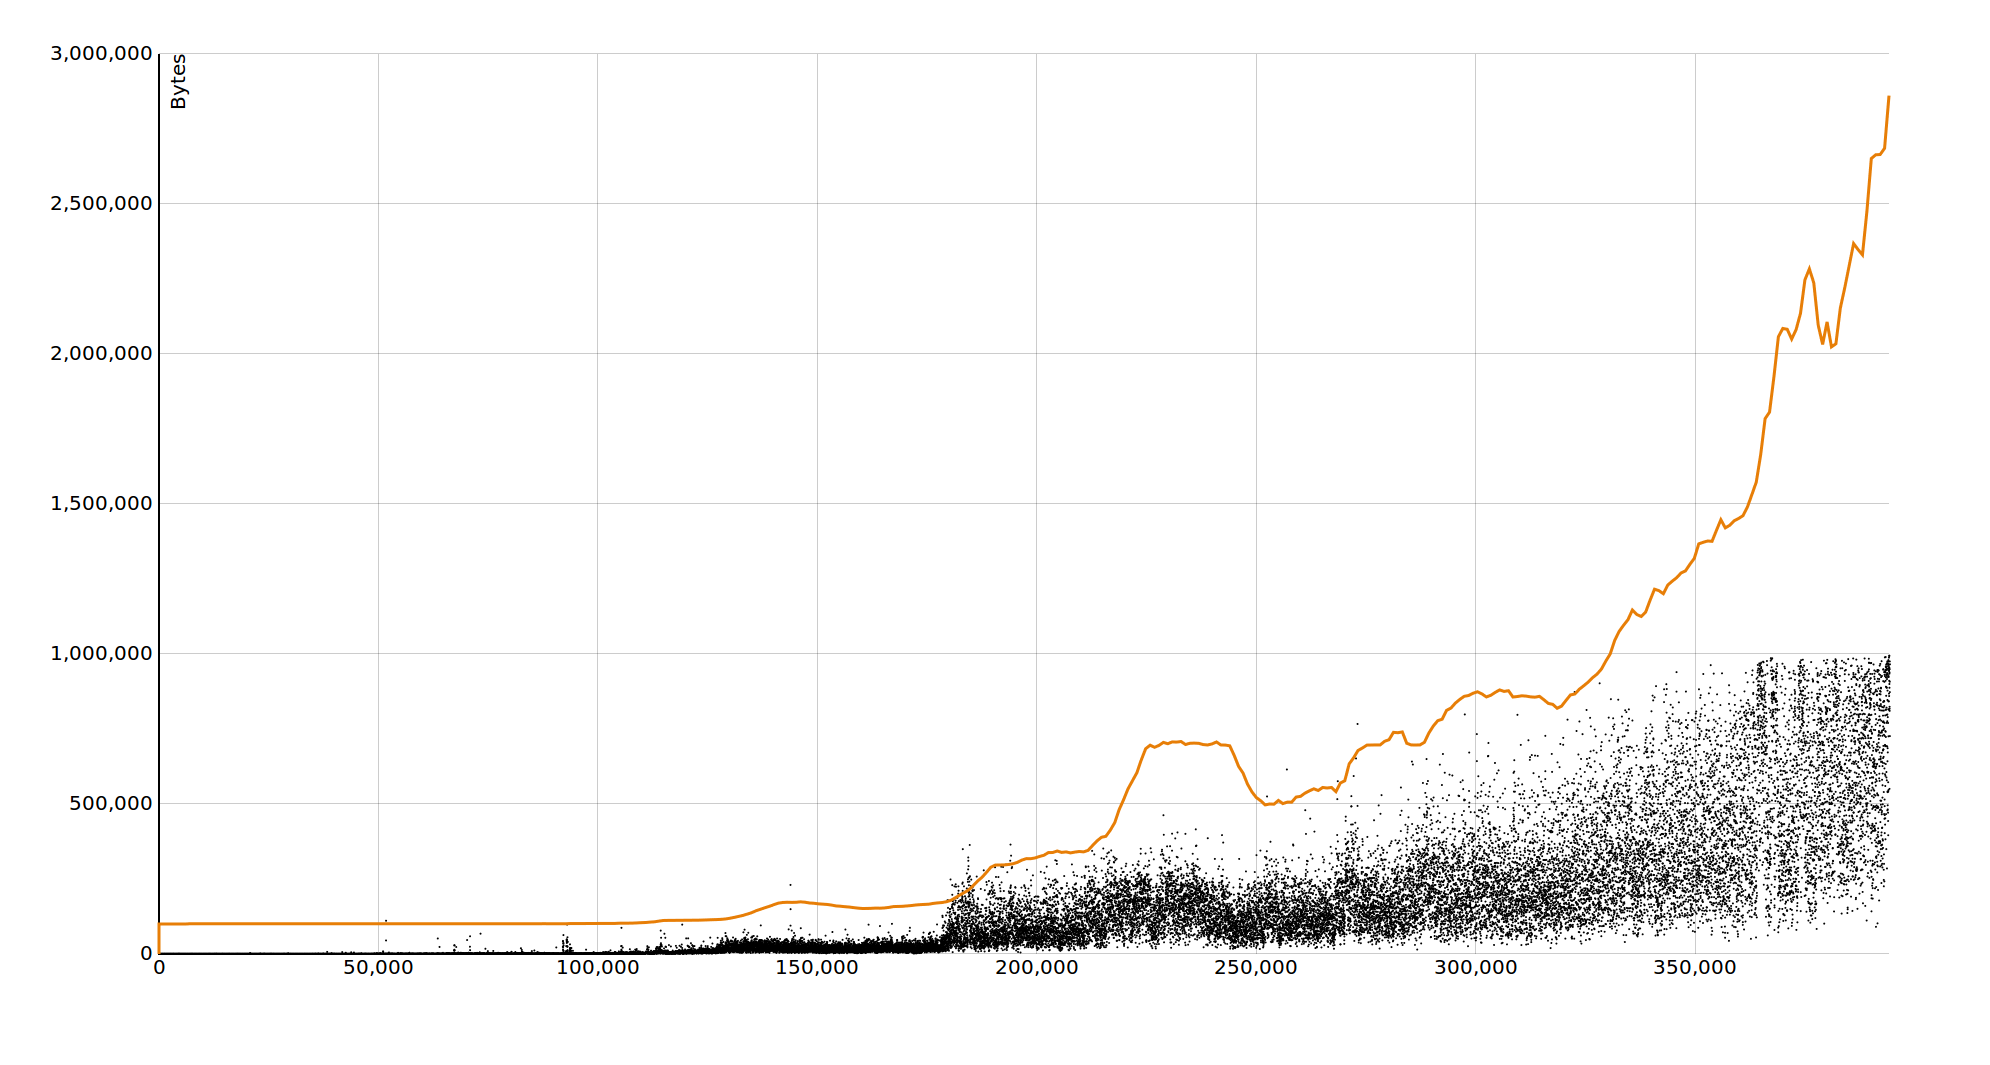
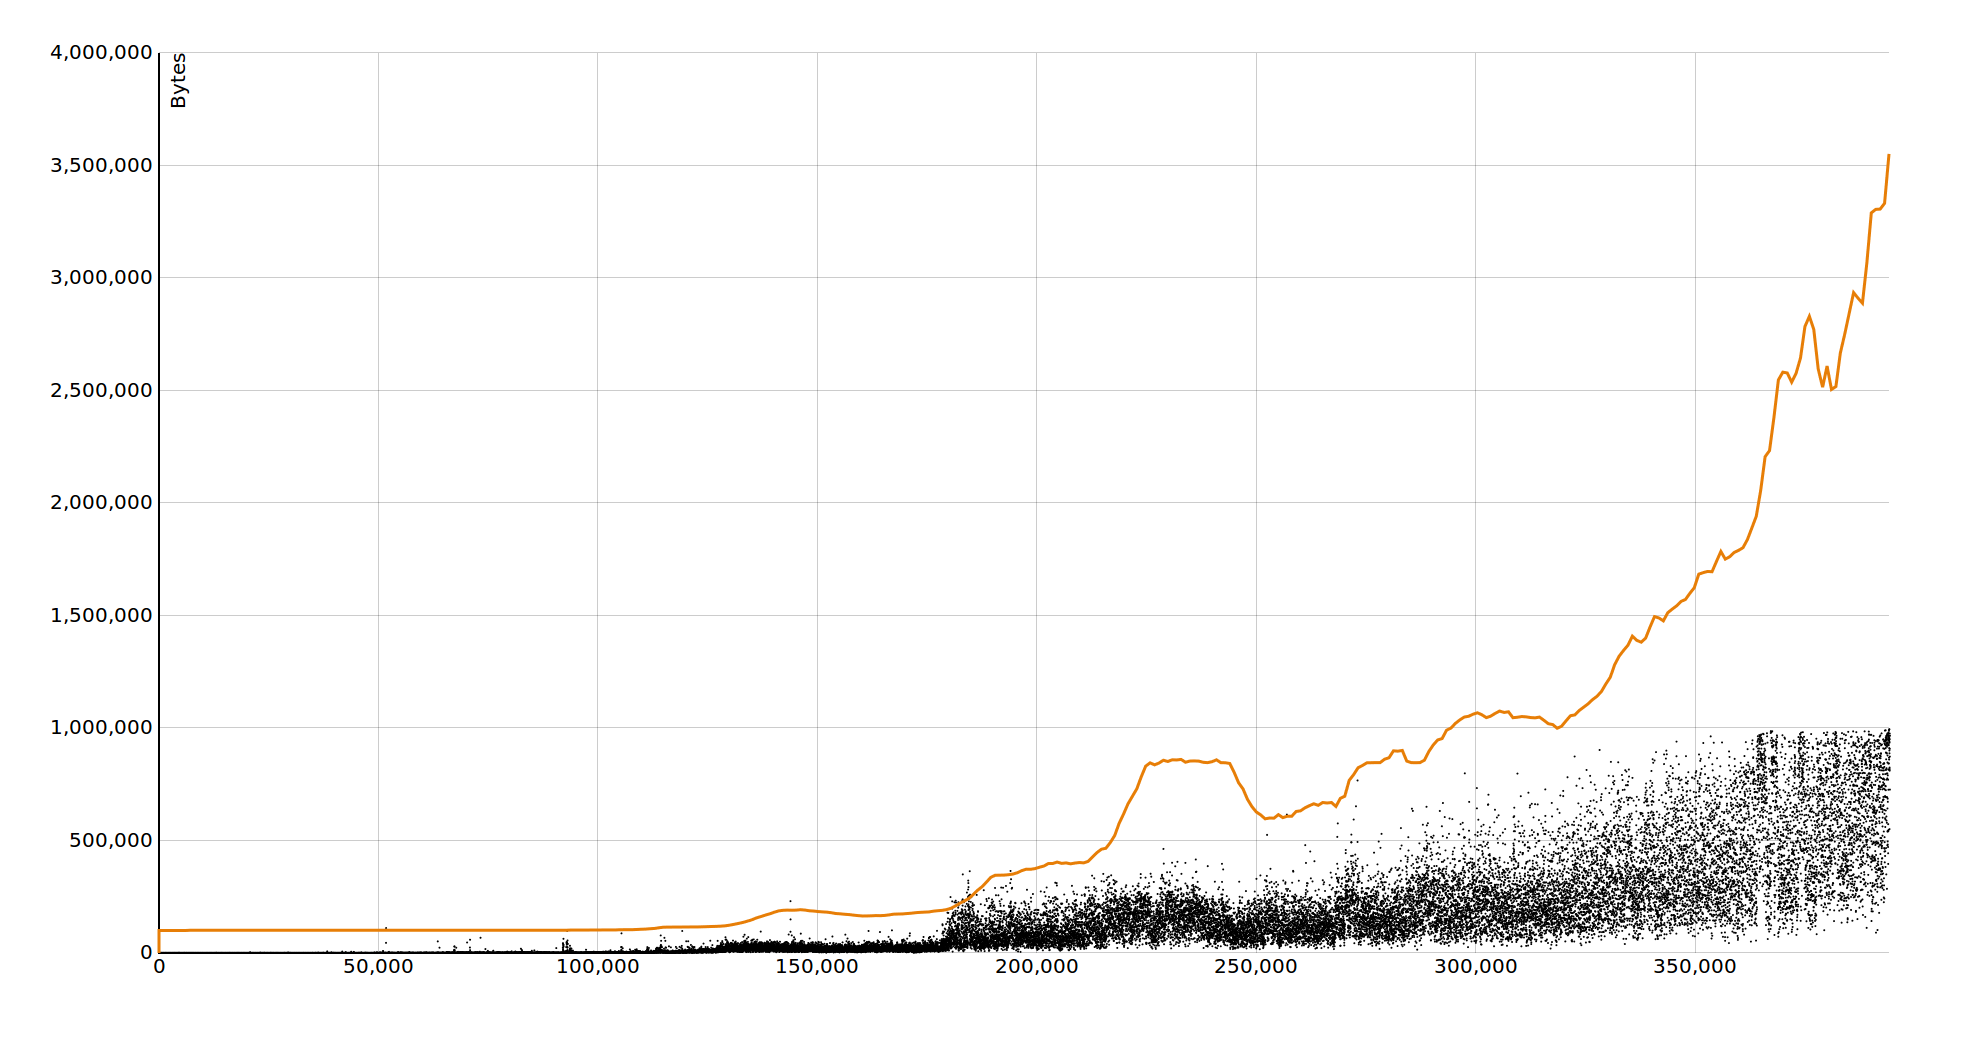
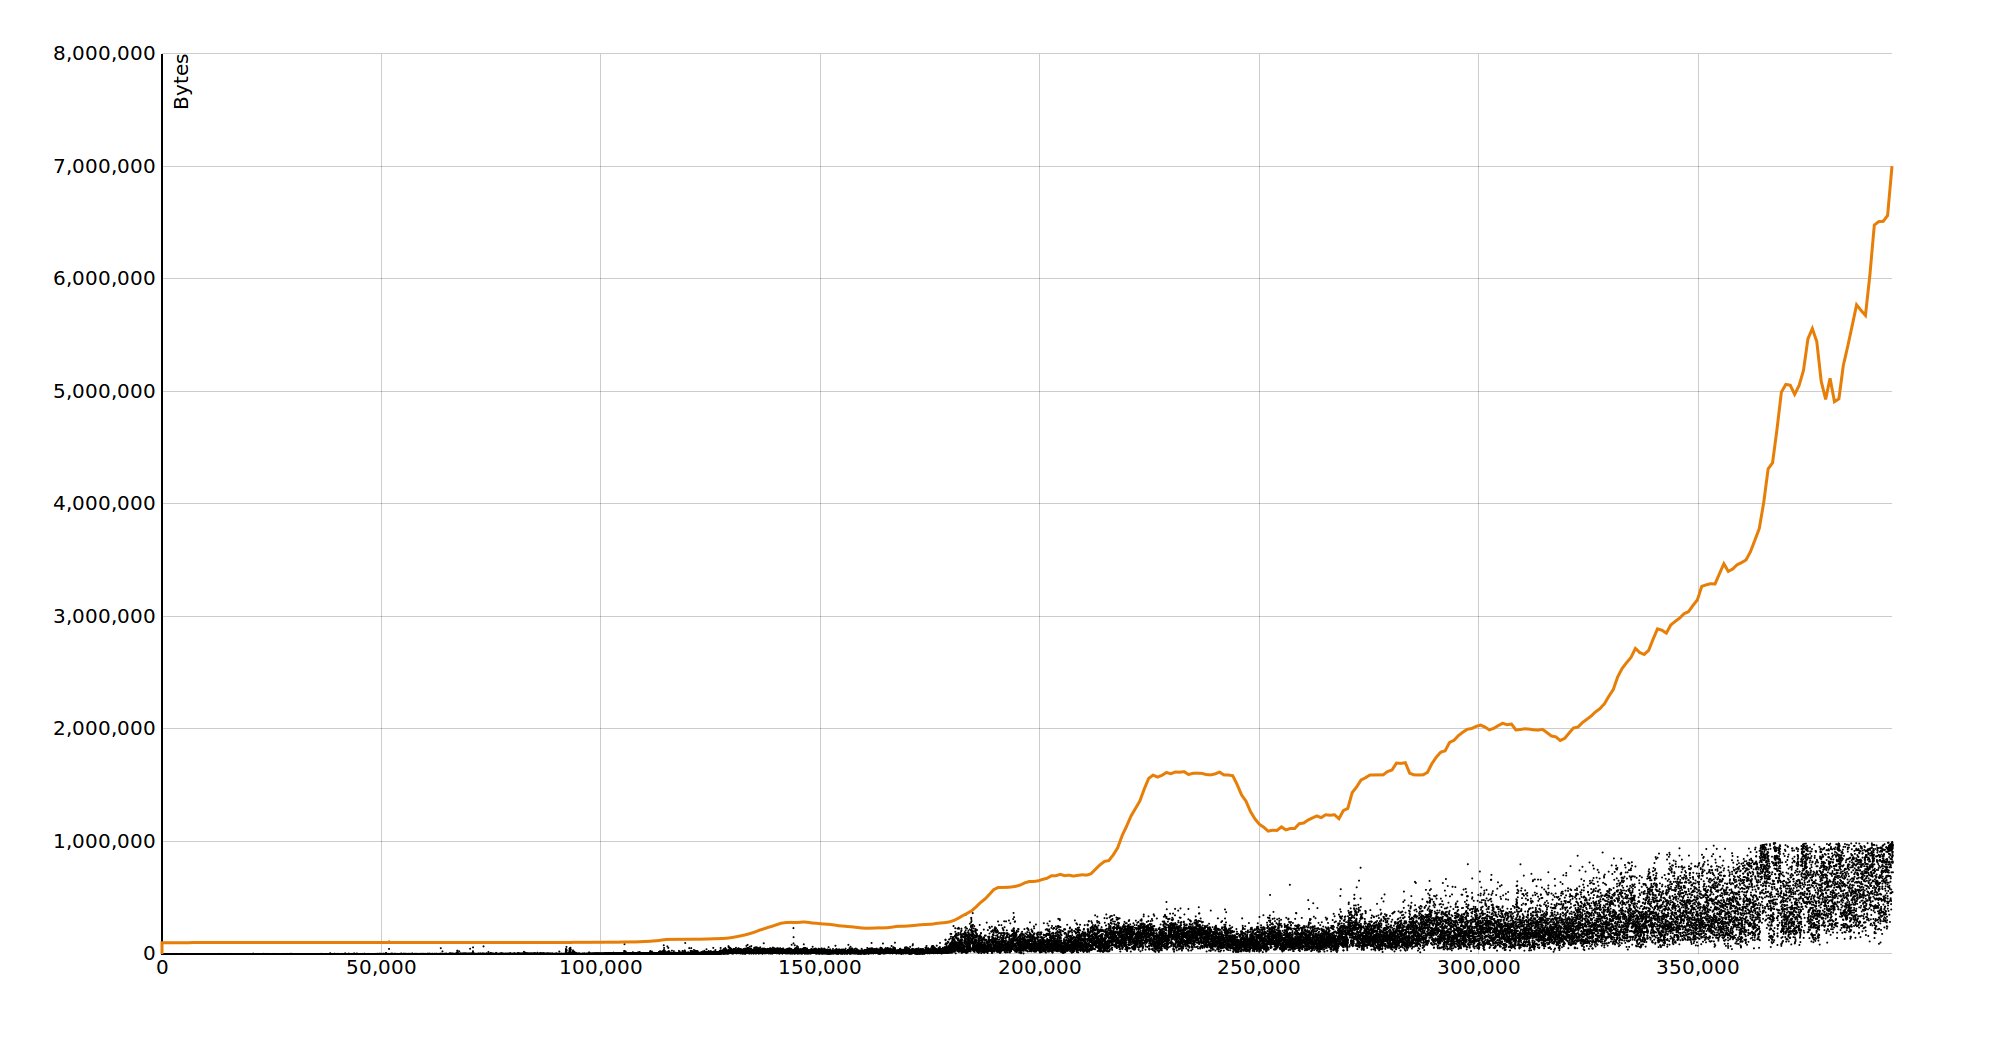
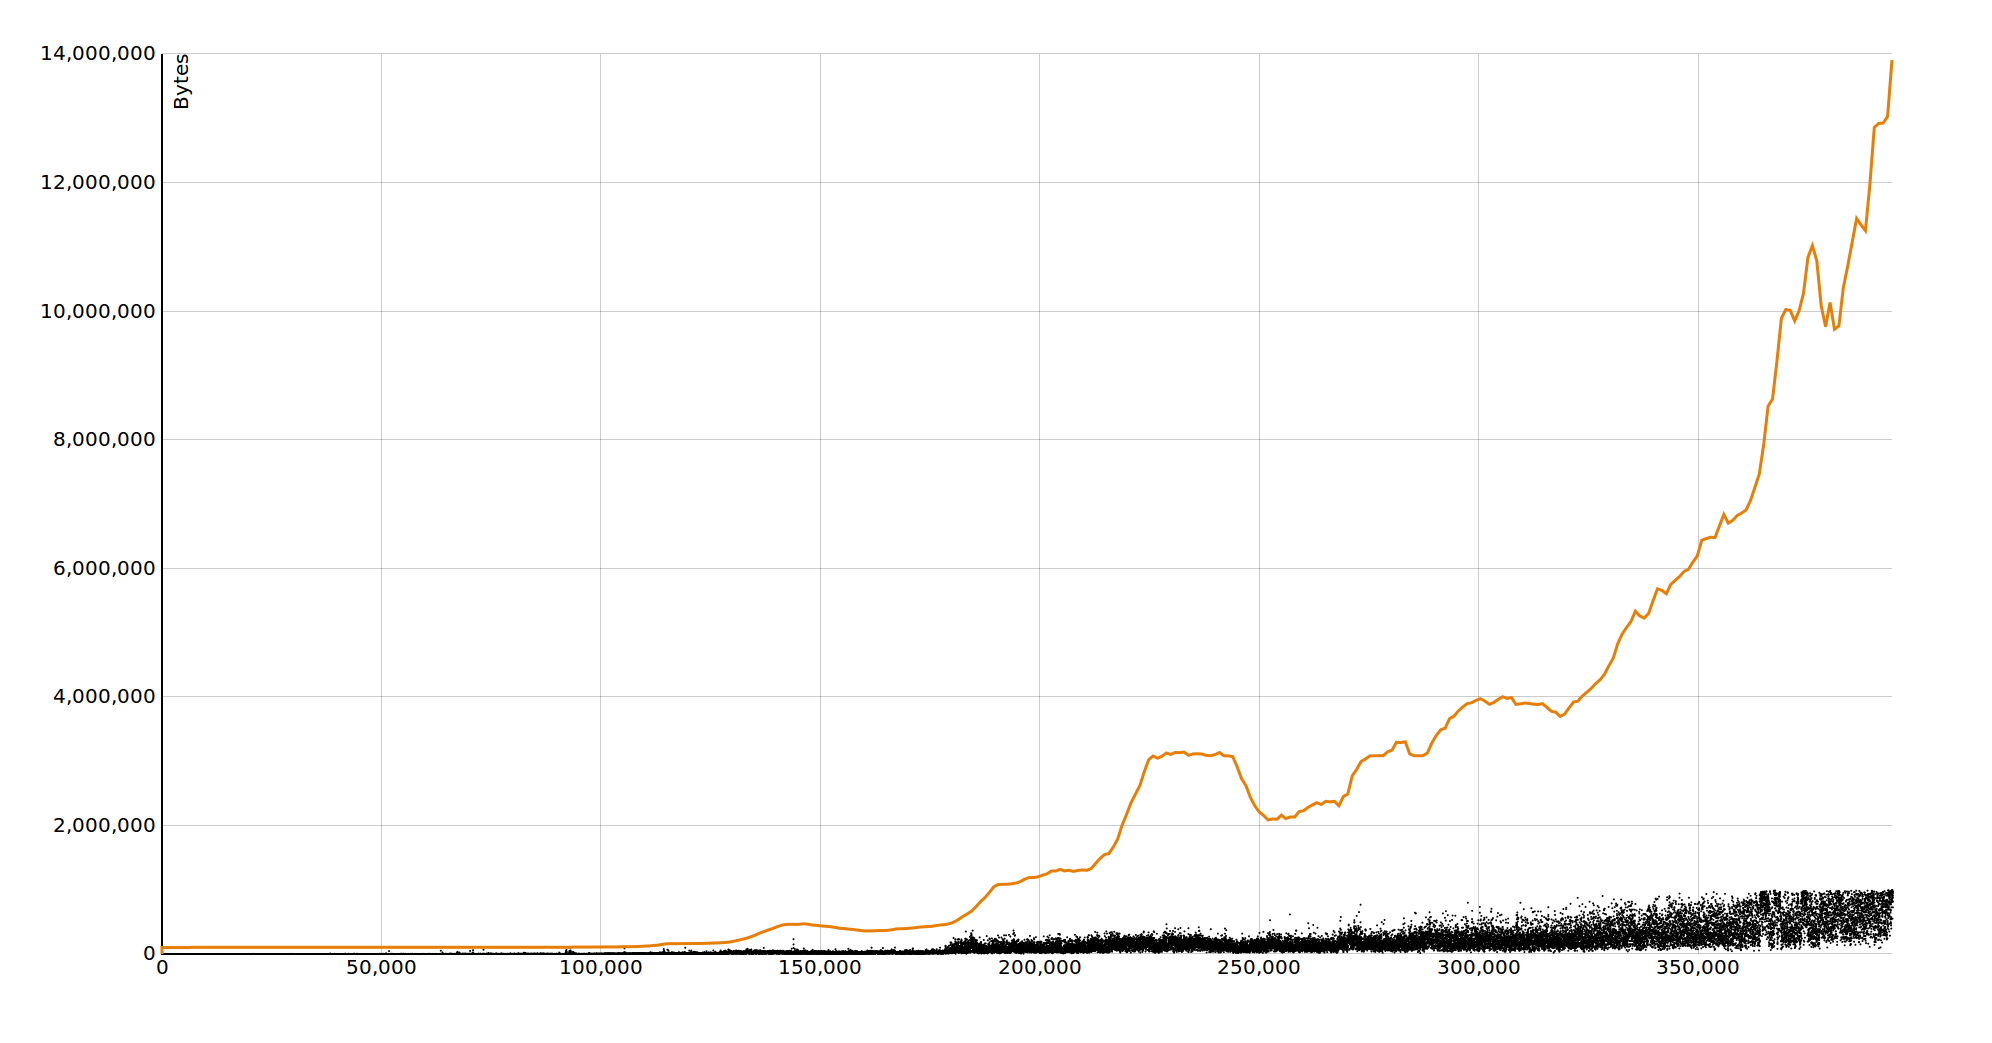
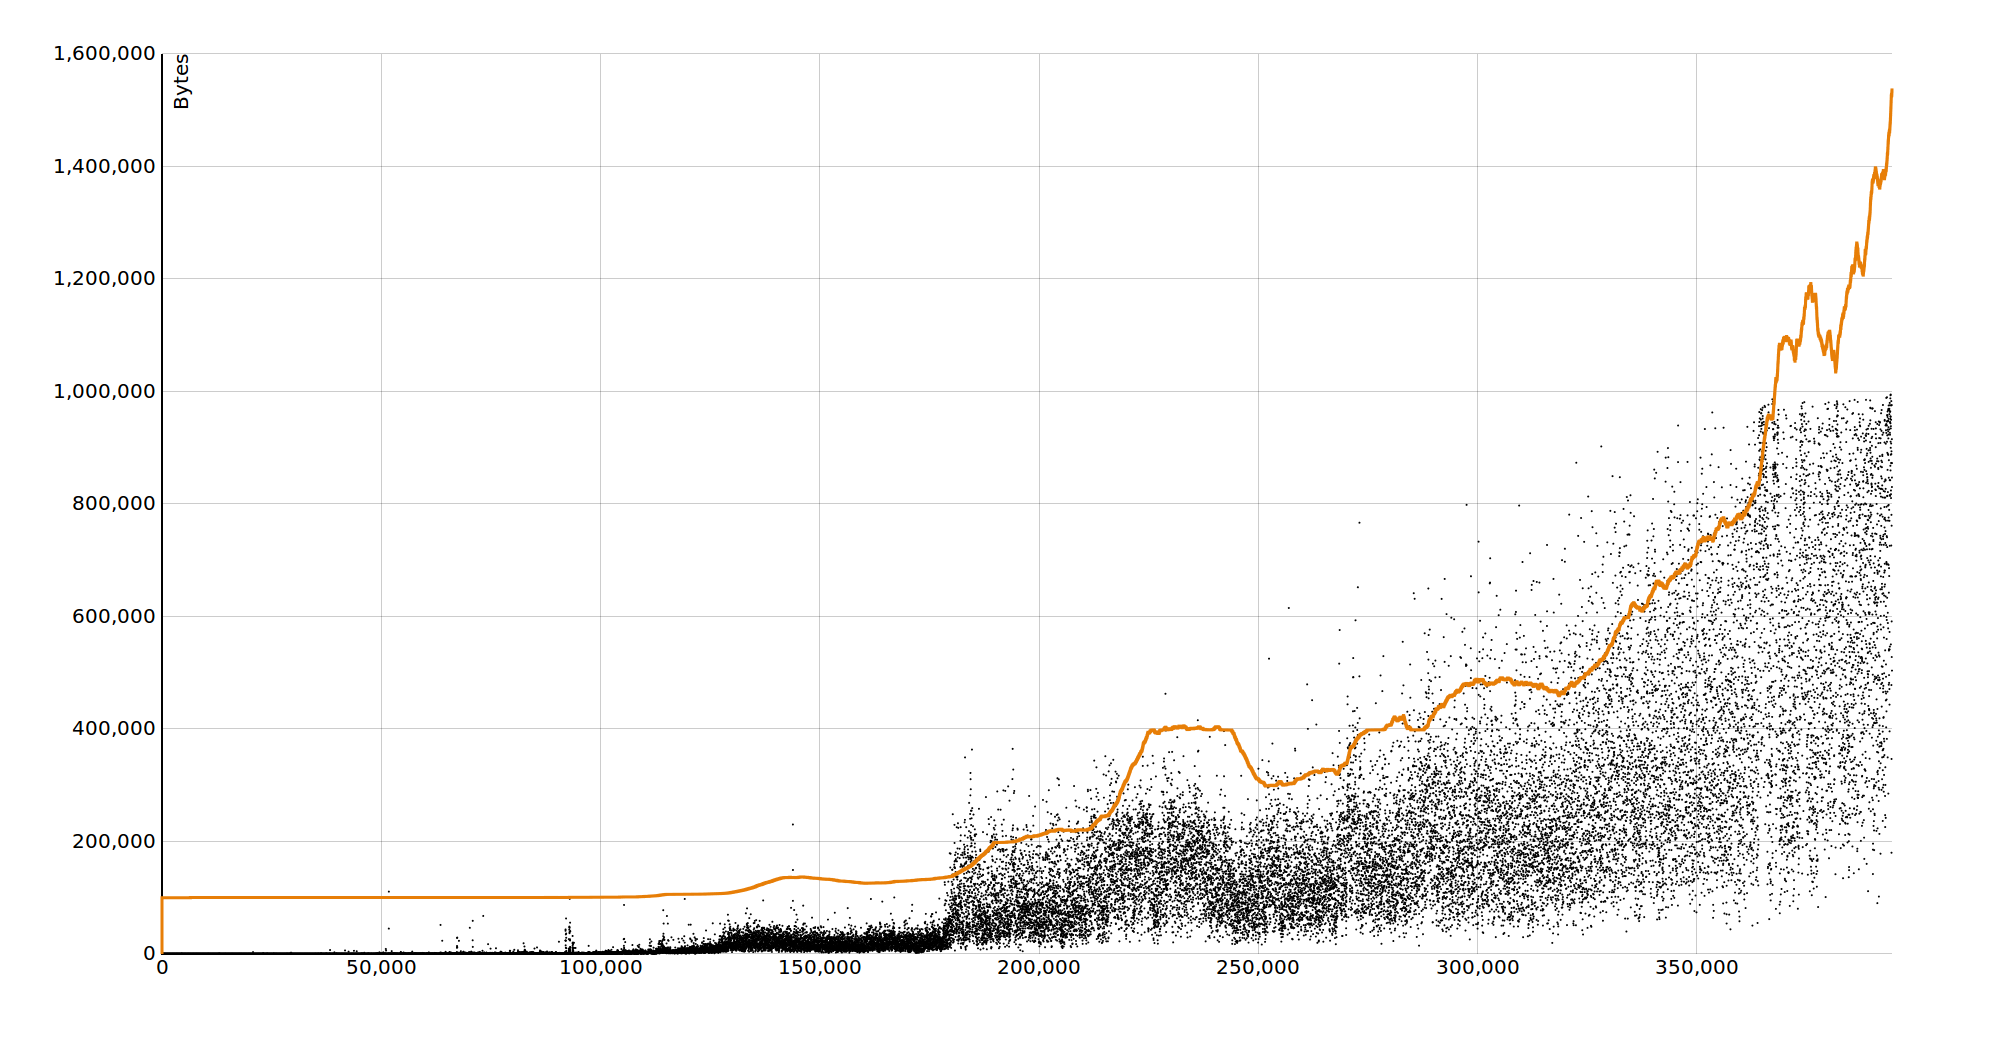
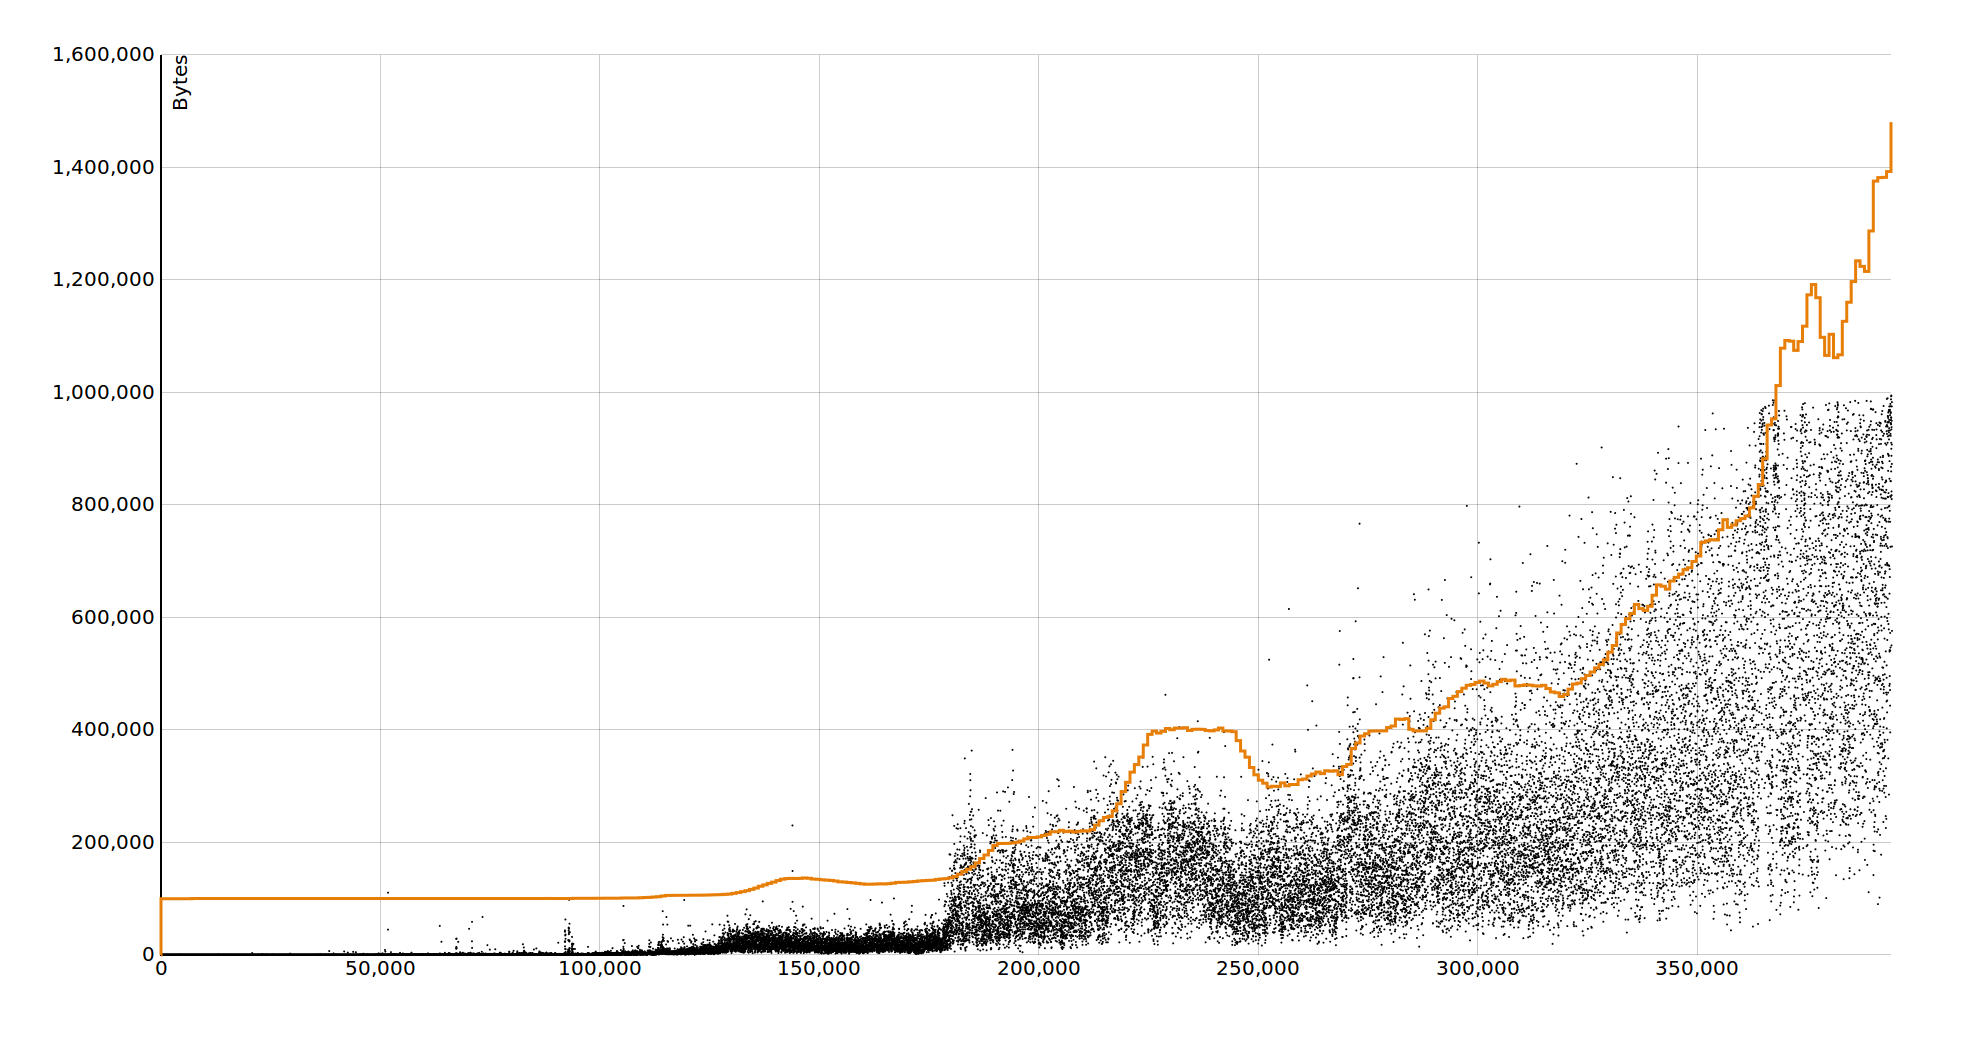
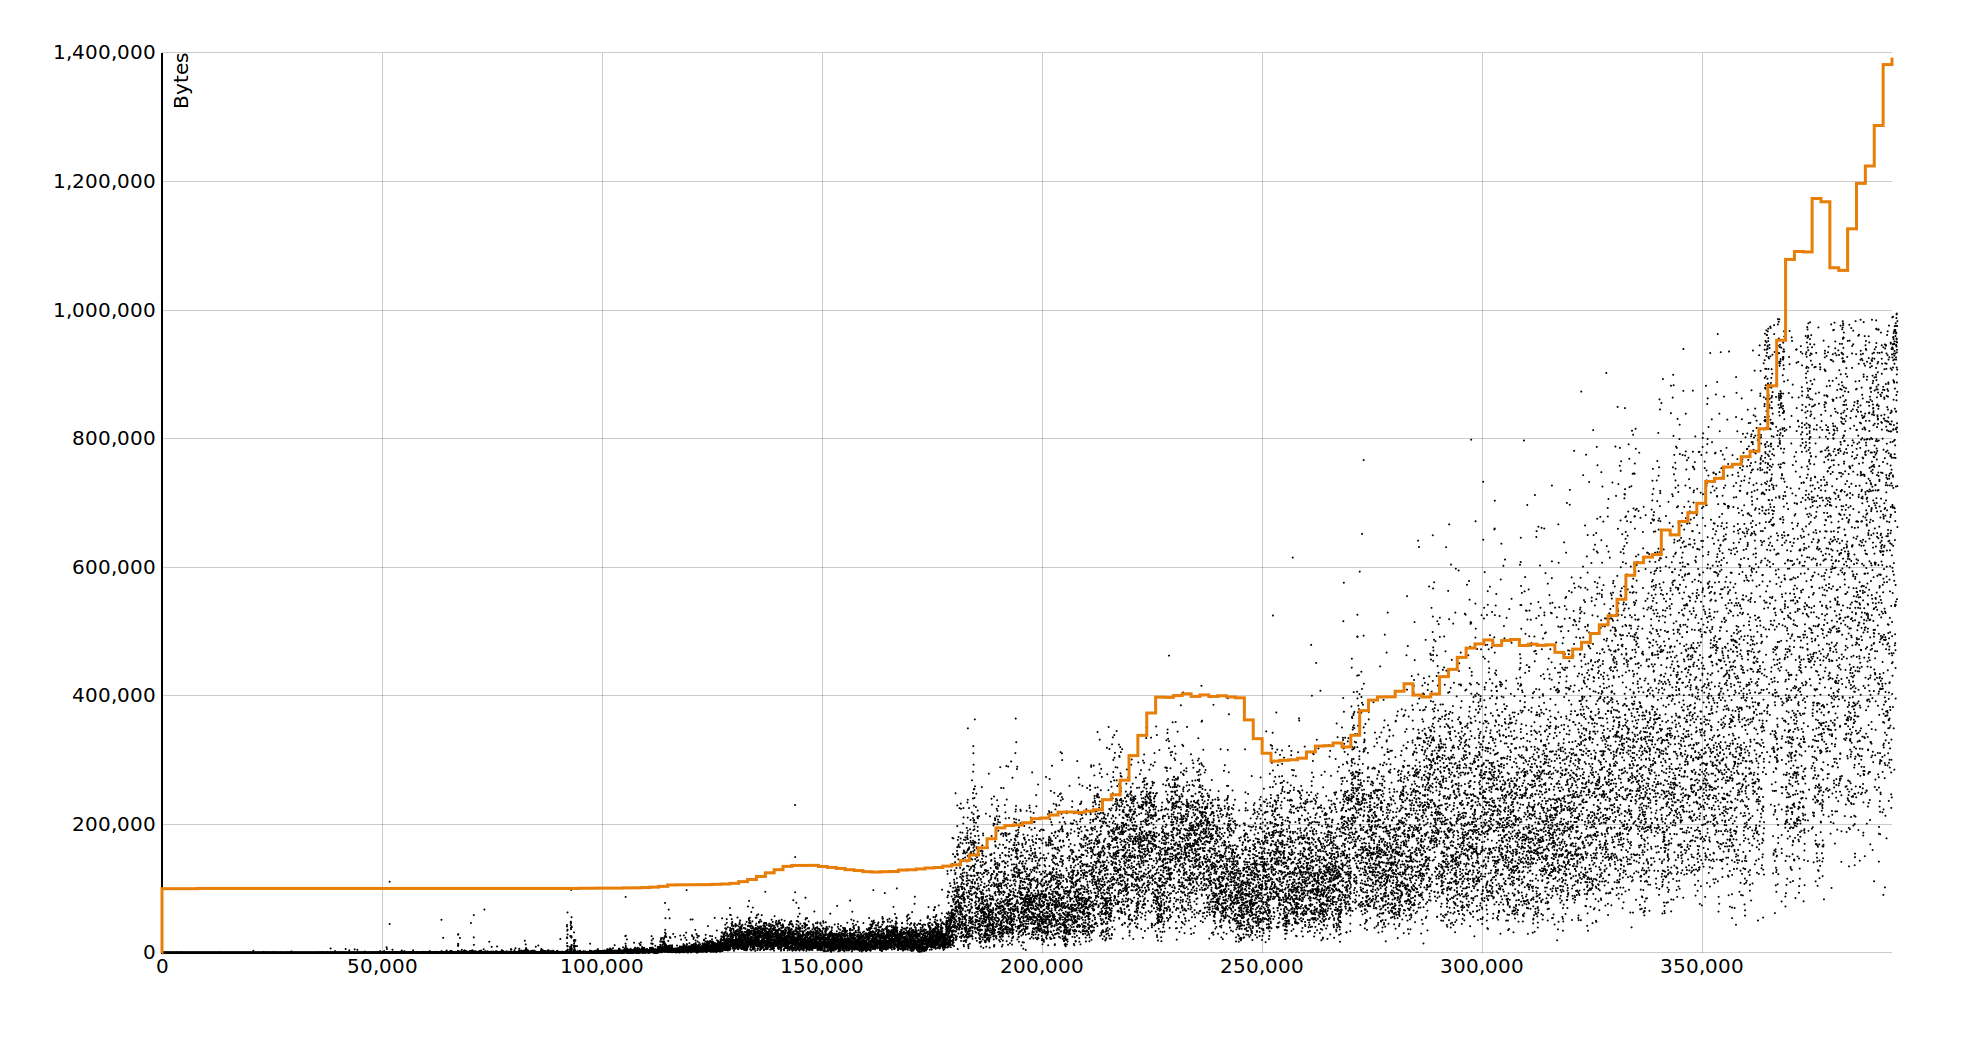
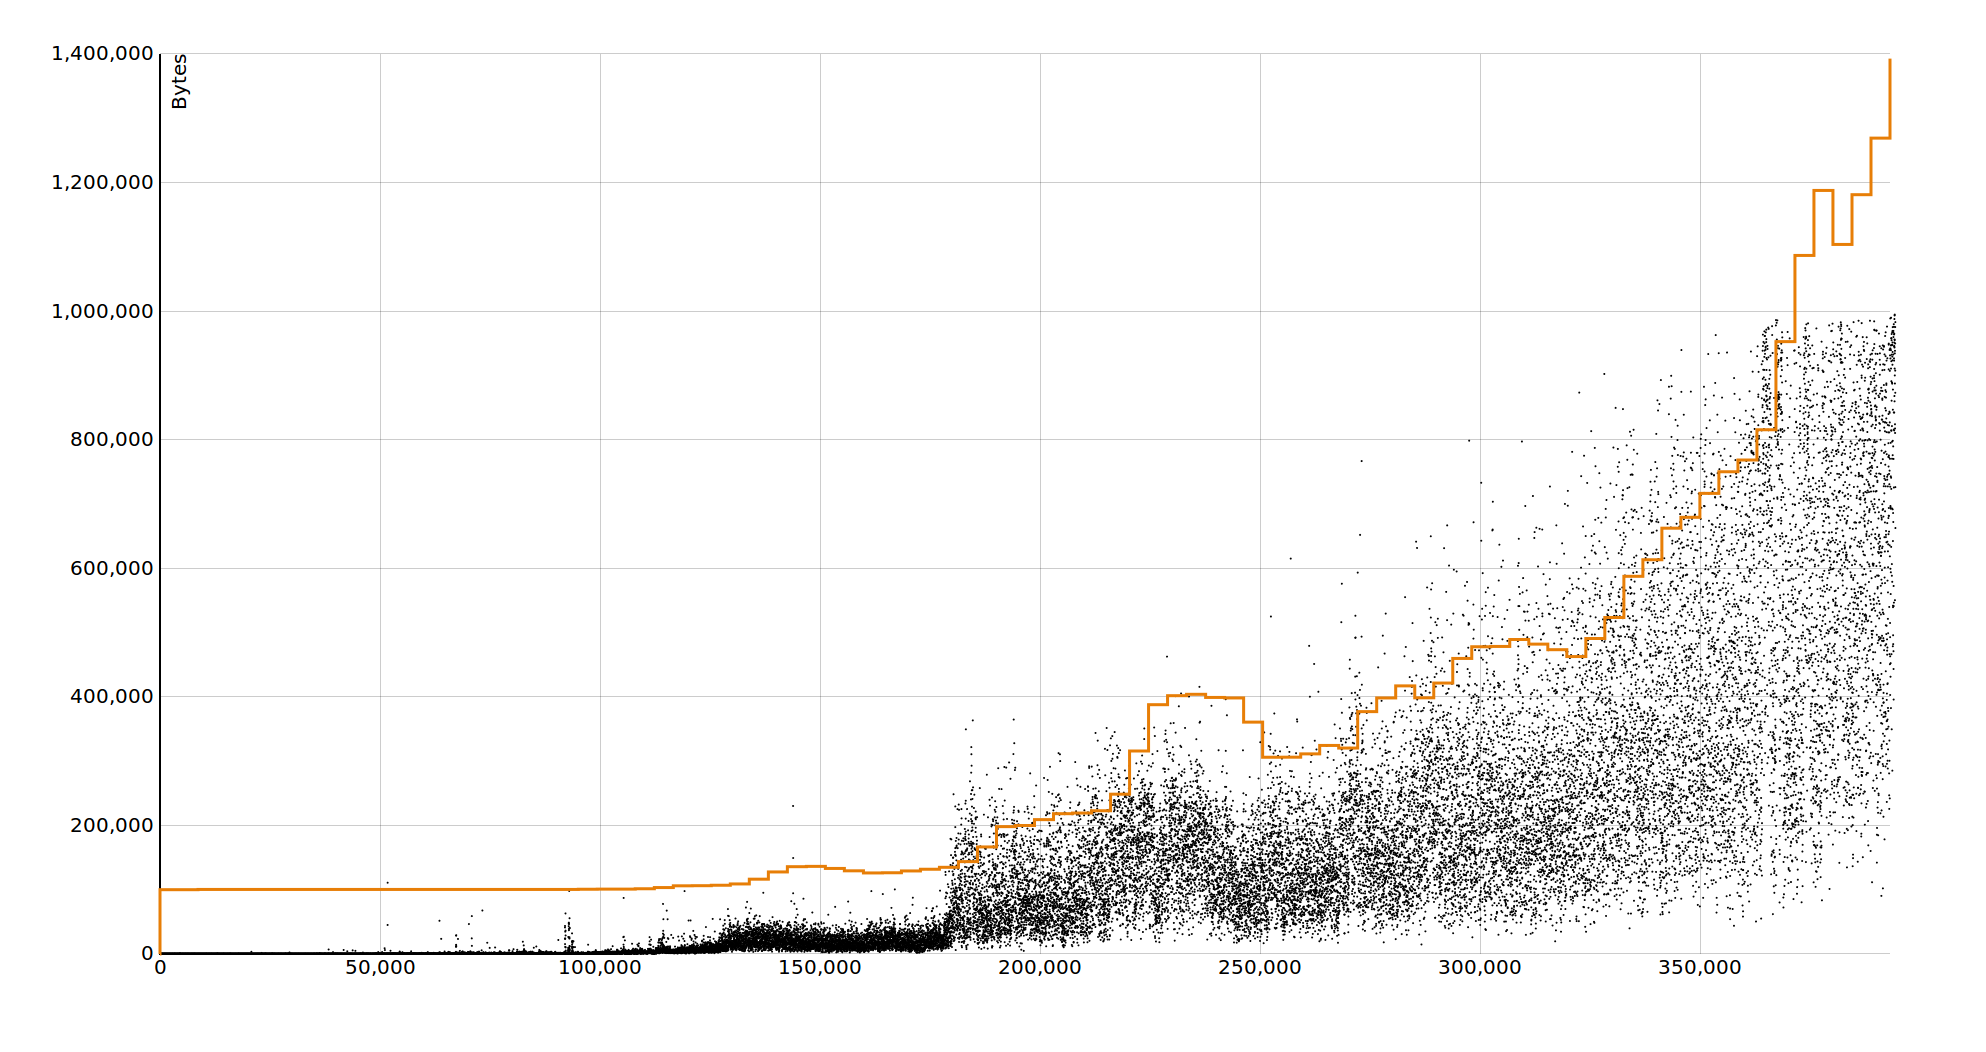
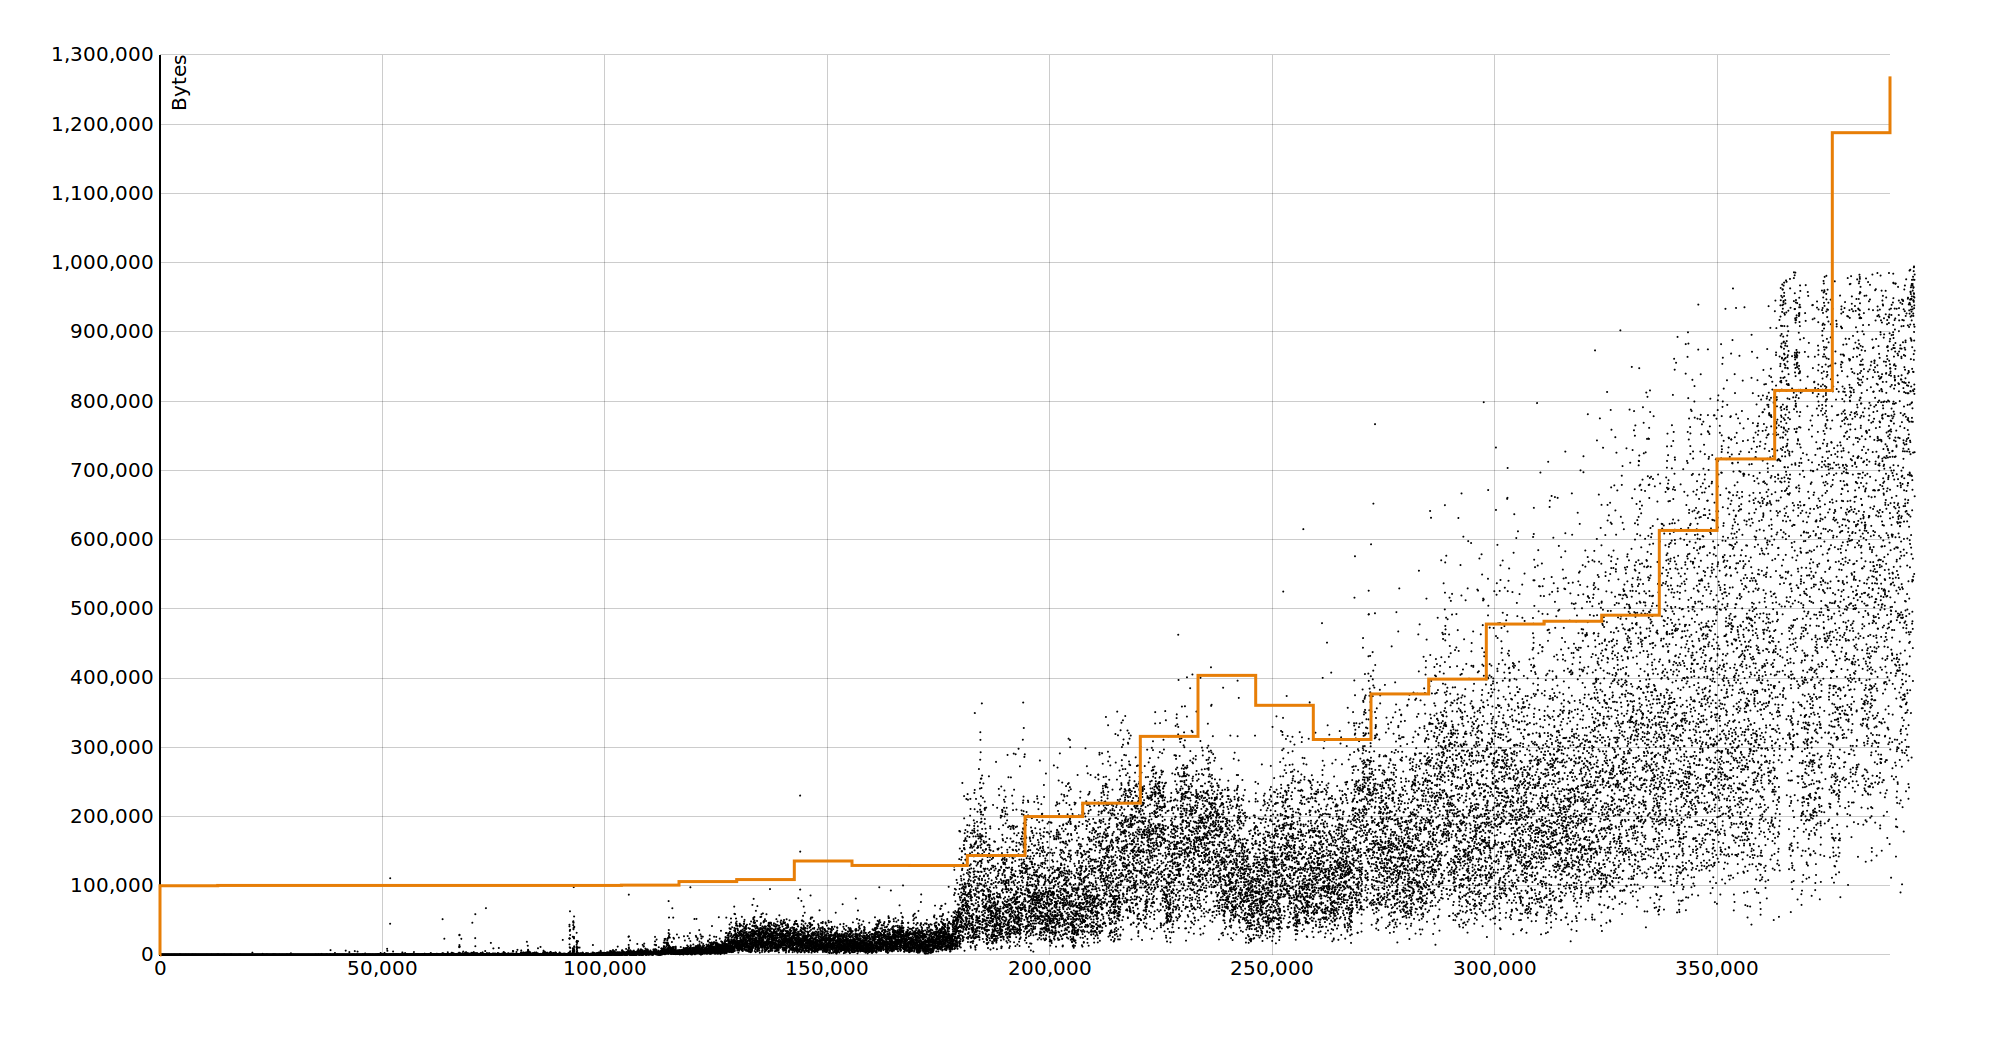
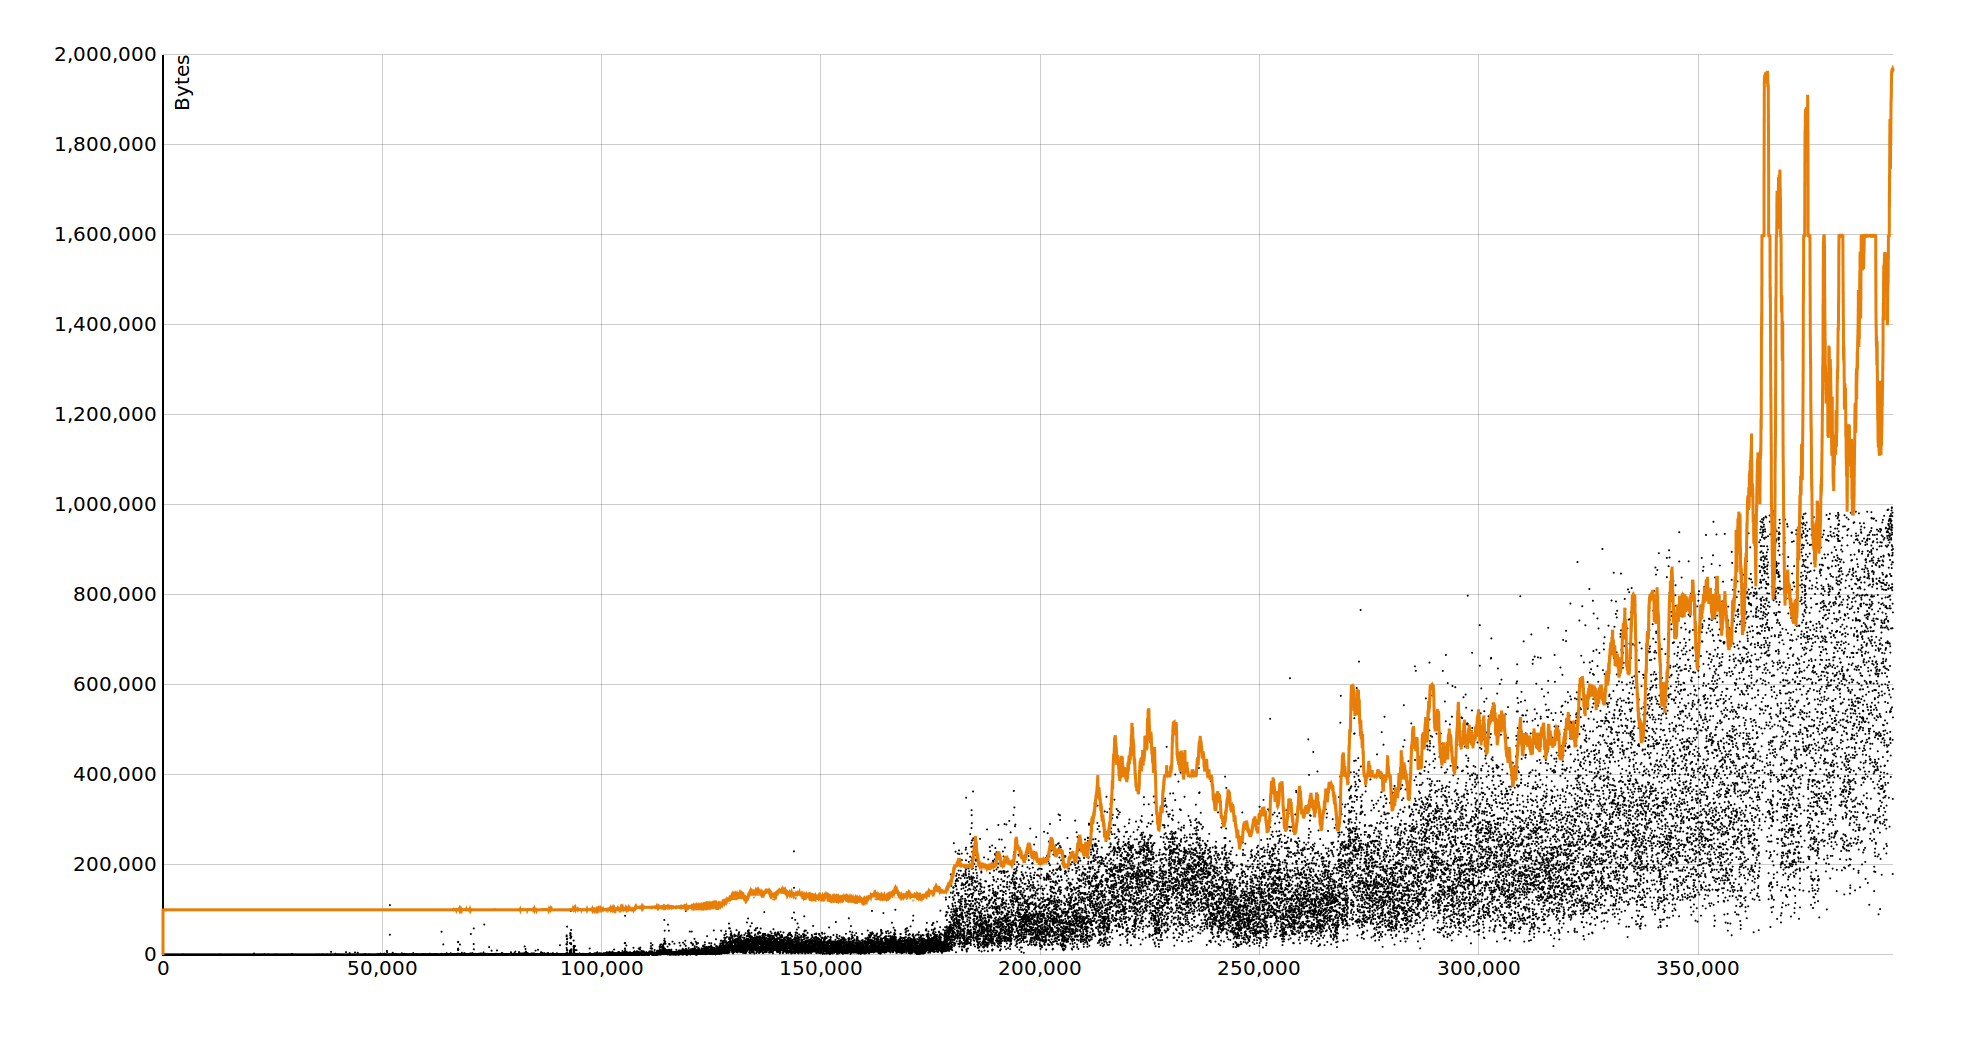
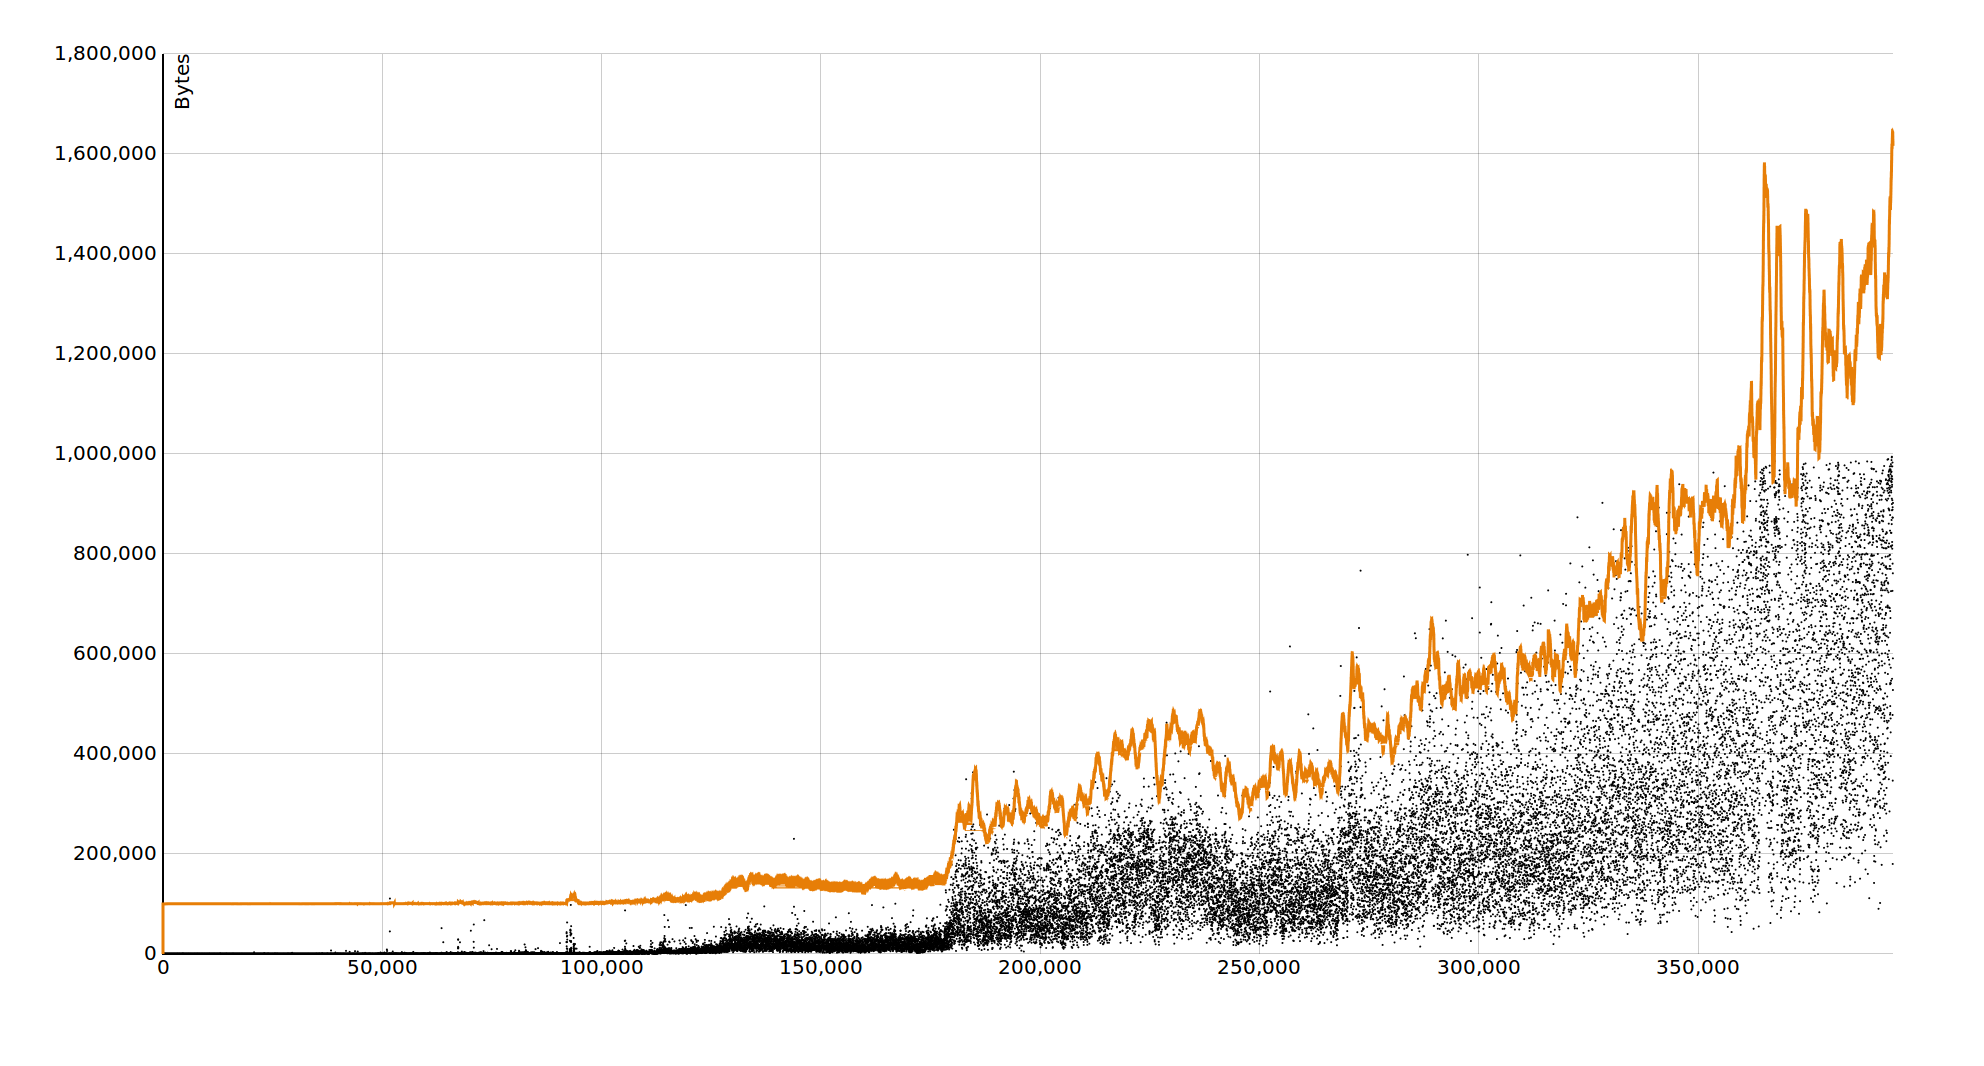
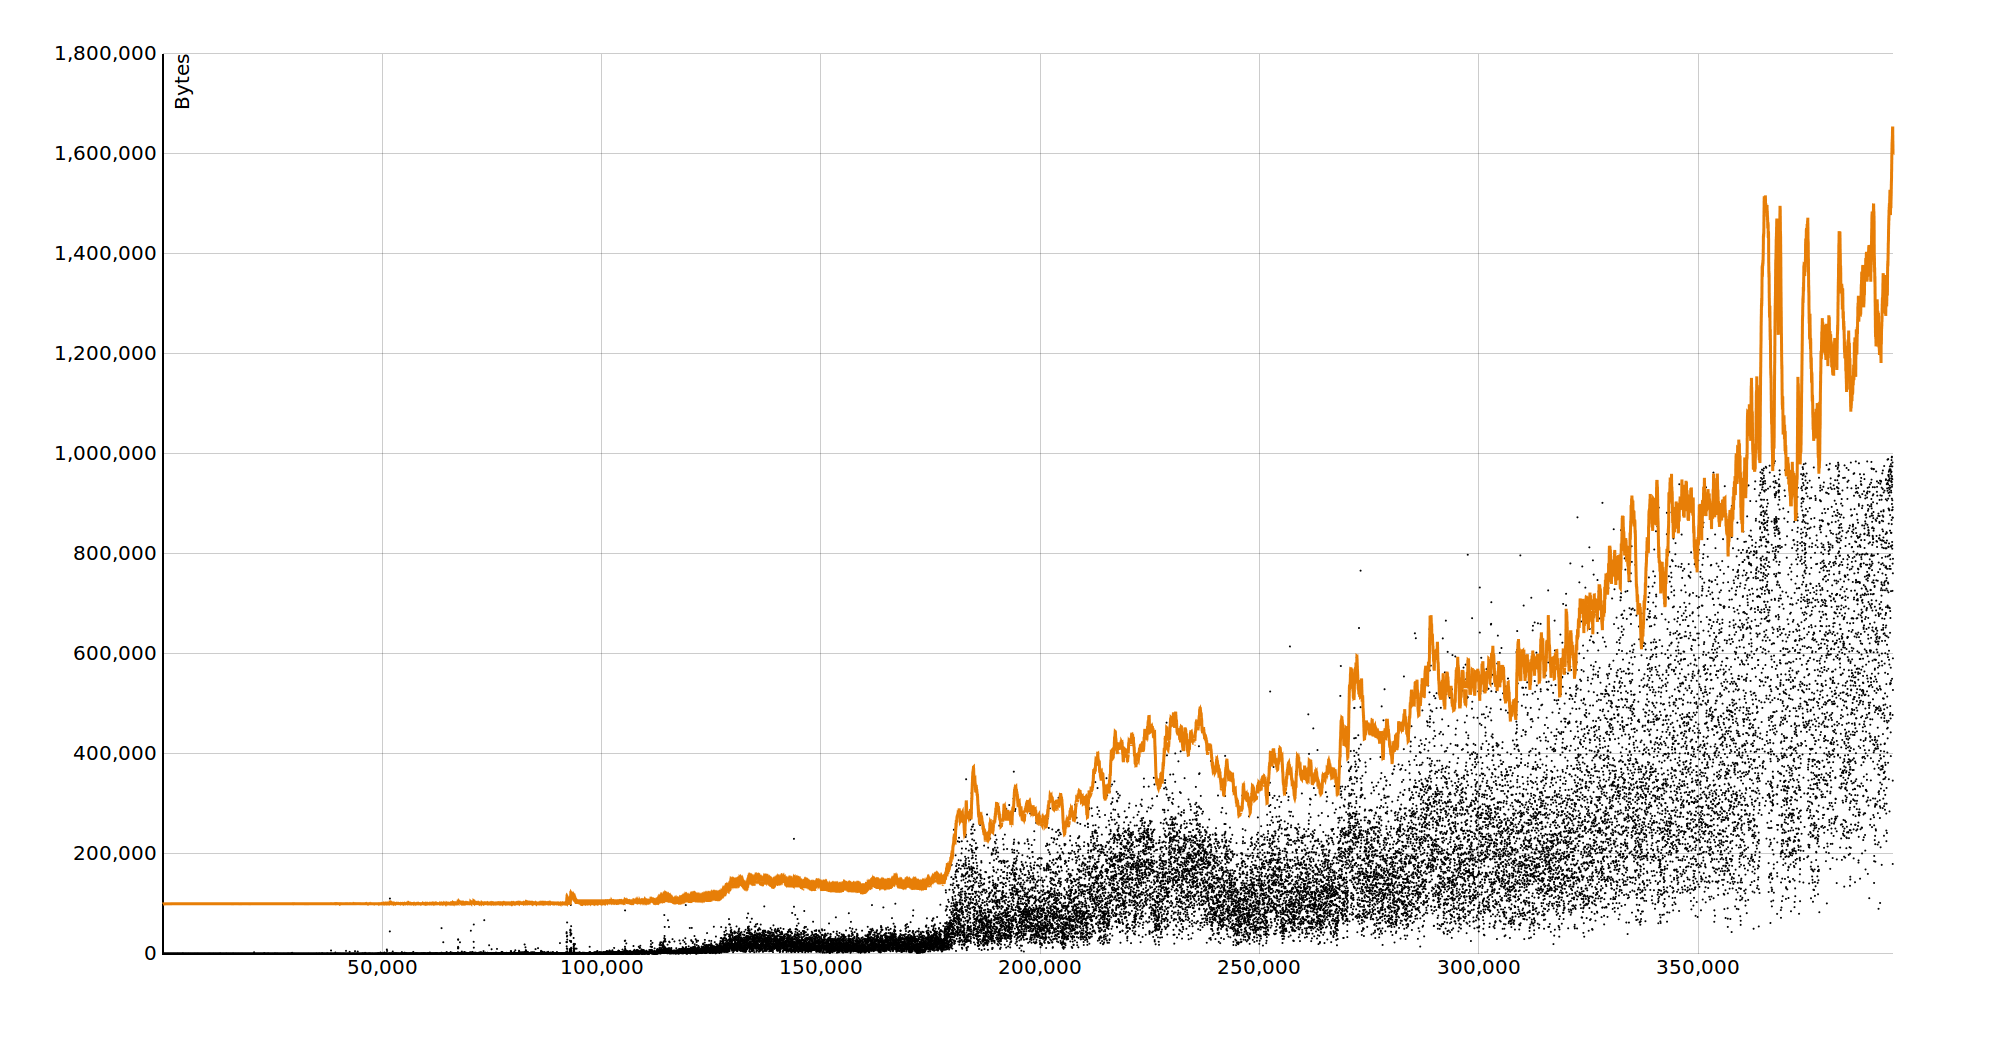
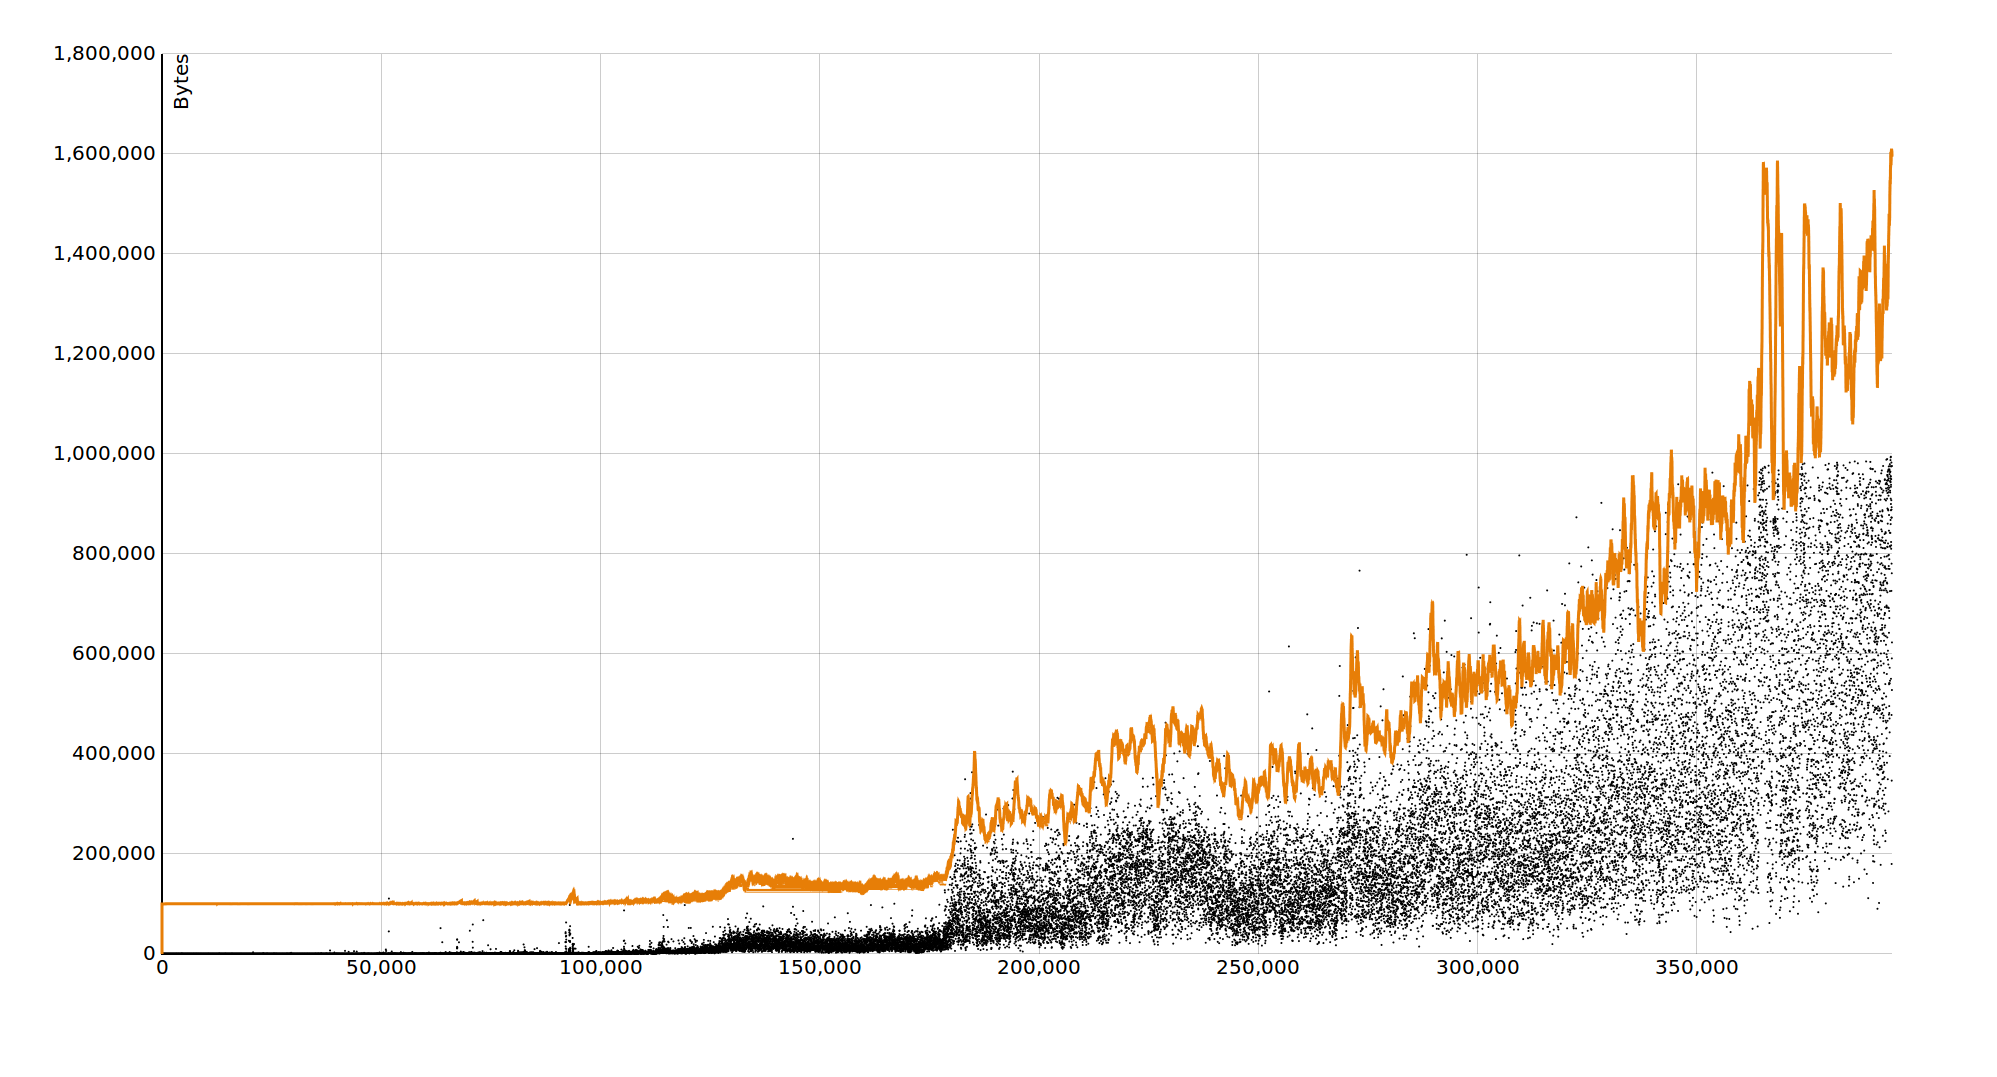
The charts are generated based on historical Bitcoin livenet block sizes (CSV). The orange line represents the maximum block size. Each black dot on the graph represents a block, where the y coordinate as the bytes of the block and the x as the block height. Each graph is biased by 100,000 bytes on the y-axis for illustration purposes, so that viewers can see that there is a line distinct from the x-axis.
Differences in Sample Size
These graphs show various range of previous blocks used to calculate the median. The maximum block size is the median doubled with an additional 100,000 bytes added, and recalculated once a week.
Last day (144 blocks)
Last week (1,008 blocks)
Two weeks (2,016 blocks)
Last month (4,320 blocks)
3 months (12,960 blocks)
6 months (25,920 blocks)
Last year (52,560 blocks)
2 years (105,120 blocks)
Differences in Multiplier
The graphs show various multipliers applied to the median. They all use a sample size of 3 months (12,960 blocks), with 100,000 bytes added, and calculated once a week.
1.25 times
1.5 times
2 times
3 times
4 times
5 times
10 times
20 times
Differences in Interval
The graphs show variations of the interval that the maximum block size is calculated, in a similar way that the mining difficulty changes once every 2016 blocks. All graphs use a three month median multiplied by 2 with 100,000 bytes added.
Every block (1 block)
Every day (144 blocks)

Once a week (1,008 blocks)
Once every two weeks (2,016 blocks)
Once every month (4,320 blocks)
Once every 3 months (12,960 blocks)
Once every 6 months (25,920 blocks)
Once every year (52,560 blocks)
Once every 2 years (105,120 blocks)
Differences in Median and Average Formulas
These graphs show variations of methods for calculating the moving median and average. All graphs use a sample size of three months multiplied by 2, with 100,000 bytes added, and recalculated for every block.
Moving Median
function movingMedian(range) {
  range.sort(function(a, b) {
    return a - b;
  });
  var even = (range.length % 2 === 0);
  var m;
  if (even) {
    var mid = range.length / 2;
    var sum = range[mid] + range[mid + 1];
    m = Math.round(sum / 2);
  } else {
    var mid = Math.floor(range.length / 2);
    m = range[mid];
  }
  return m;
}
Moving Average
function movingAverage(range) {
  var total = range.length;
  var sum = range.reduce(function(a, b) {
    return a + b;
  }, 0);
  return Math.round(sum / total);
}
Exponential Moving Average
function exponentialMovingAverage(blockSize, numberOfBlocks, lastBlockSizeAverage) {
  var k = 2 / (numberOfBlocks + 1);
  return blockSize * k + lastBlockSizeAverage * (1 - k);
}
Weighted Moving Average
function weightedAverage(range) {
  var triangle = range.reduce(function(a, b, n) {
    return a + n;
  }, 0);
  var result = 0;
  for (var i = 0; i < range.length; i++) {
    result = result + (range[i] * (i + 1) / triangle);
  }
  return Math.round(result);
}